|
|
| |
Information identified as archived is provided for reference, research or recordkeeping purposes. It is not subject to the Government of Canada Web Standards and has not been altered or updated since it was archived. Please "contact us" to request a format other than those available.
 |
11-010-XIB |
|||||||||||||||
Feature article
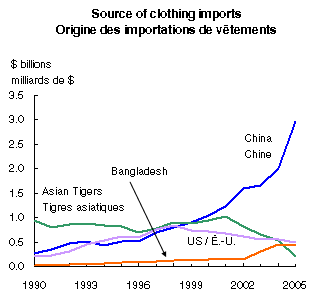
Trade liberalization and the Canadian clothing marketby Diana Wyman* Much of the attention paid to trade in clothing focuses on the recent growth of imports from China. China was Canada’s top source of clothing imports at $3.0 billion in 2005, and clothing imports for the January to September 2006 period were 15% higher than in 2005. This fixation on China, however, mistakenly identifies the shifts in the Canadian clothing market as a recent phenomenon. In reality, the turn to China was just the latest in a series of changes in Canada’s trade in clothing over the last two decades. This paper looks at how Canada’s trade in clothing has changed since 1989, particularly in response to the liberalization of trade that began with free trade with the US and culminated in the lowering of trade barriers with less-developed countries, notably China. It concludes with a look at the impact on domestic production and jobs and the lower prices paid by consumers of clothing. Figure 1
OverviewUntil the 1960s, Canadians wore clothing manufactured in Canada; very little was imported. In the 1960s, countries such as Hong Kong, South Korea and Taiwan emerged as manufacturing powerhouses, specifically in industries such as clothing which required little capital but considerable manpower. Canada, along with other major importers such as the United States and the European Union, negotiated agreements with these countries to limit imports of clothing. Over time, a system of quotas emerged as a result of bilateral restraint agreements with numerous developing countries with burgeoning clothing industries, such as China, India, and Bangladesh.1 These restraint agreements comprised the Multi-Fibre Arrangement (MFA), first negotiated in 1974 but then tightened in a series of agreements, the last of which was negotiated in 1986. The first structural shift discussed in this paper was the surge in Canadian clothing exports to the United States and a reciprocal gain in imports from American companies following the introduction of the Canada-United States Free Trade Agreement (FTA) in 1989. As recently as 1998, the United States was Canada’s primary foreign supplier of clothing. As well, Canada’s exports in the decade following the FTA increased more than ten-fold, revitalizing the clothing industry. The second shift occurred as a result of Canada gradually extending unrestricted access to the Canadian market to some least developed countries by January 1, 2003. This secured an advantage for these countries exporters because competitors still faced quotas and double-digit tariffs. As a result, Canada’s imports from Bangladesh tripled between 2002 and 2005. So far in 2006, clothing imports from Bangladesh are slightly greater than those from the United States, leaving Bangladesh in second place behind China. From 1995 to 2002, quotas were lifted on certain products for all World Trade Organization (WTO) member countries, as stipulated by the WTO Agreement on Textiles and Clothing. Since China was not a WTO member until December 2001, China was only able to participate in the final stages of the Agreement, from 2002 to 2005. The third and final shift, the tremendous growth of clothing imports from China, has dominated recent headlines. An often overlooked part of this change has been that imports from China displaced imports from historical suppliers such as Hong Kong, Taiwan, South Korea and other developing countries and from the United States, as well as domestic production. The result was that many countries’ clothing industries that flourished before 2002 saw their clothing exports to Canada displaced by imports from China in the final years of the Agreement. This is reflected in Canada’s overall clothing imports increasing only 7% in 2005, while imports from China jumped 47%. A select few, such as India, Mexico, and Bangladesh, managed to hold onto their increased share of the Canadian market for imports. Figure 2
Since 2002, consumers started to reap the rewards of trade liberalization in lower prices. After decades of rising clothing prices in Canada, prices starting falling. Production and employment in Canada’s clothing industry, which is concentrated in Quebec and Ontario, also declined in the final years of the implementation period of the WTO Agreement on Textiles and Clothing. The FTA and trade in clothingThere was much less international trade in clothing prior to the introduction of the Canada-US Free Trade Agreement (FTA) in 1989. At that time, clothing imports from and exports to the United States stood at just below $200 million annually, which accounted for 86% of all our clothing exports and 10% of total clothing imports. The FTA changed the face of trade in clothing with the United States. Imports from the United States peaked in 1998 at $800 million, quadruple the pre-FTA value. In 1998, US clothing accounted for 19% of clothing imports and 9% of the clothing market in Canada. As recently as 1998, the United States was our number one supplier of clothing. In the early 1990s, developing country clothing exporters were subject to quotas on clothing exports and faced tariffs of over 20%. In contrast, as a result of the FTA, tariffs on clothing products originating in the United States fell toward zero and no quotas were ever in place between Canada and the United States. This ensured that, in addition to the close proximity and similar fashion culture, clothing products from the United States were in high demand in Canada and vice versa. Figure 3
Clothing exports to the United States peaked in 2000, having increased more than ten-fold to $2.7 billion after the FTA took effect. As a result of this rising demand from US importers, Canadian production rose to $7.9 billion. Accordingly, employment in the Canadian clothing industry rose by nearly 20,000 to a peak of 94,000 employees in 2001. Quebec and Ontario house the majority of Canada’s clothing production and thus it was central Canada that registered the greatest gains from the growth in exports to the United States. Employment in the clothing industry in Quebec peaked at 54,000 in 2001 while employment in Ontario increased to 23,000. Figure 4
The Uruguay Round fostered more liberalizationOne result of the World Trade Organization’s Uruguay Round of negotiations was that the member countries of the World Trade Organization agreed to gradually remove all quotas on clothing between 1995 and 2005. A requirement of the Agreement on Textiles and Clothing (ATC) was that quotas were to be increased, then eliminated, in four stages: by January 1 in each of 1995, 1998 and 2002. Then, all remaining quotas were to be removed by January 1, 2005. Tariff reductions were also negotiated as part of the Uruguay Round. Unlike the United States and the European Union, Canada did not reinstate quotas on clothing imports from China beyond the 2005 deadline, partly because the influx of imports was smaller than for the US or the EU.2 In 1995, as a result of the WTO Agreement on Textiles and Clothing, many developing countries were offered expanded quotas and a drop in tariffs on clothing. This secured an advantage for WTO member countries because these quota expansions and tariff reductions were not offered to non-members like China. The result was that many developing countries saw their clothing exports to Canada flourish during the initial five years of the ATC implementation. Imports from suppliers such as Hong Kong, South Korea, and Taiwan, registered large increases from 1995 through to 2001. Other developing country clothing suppliers such as Malaysia, Thailand, Pakistan, Sri Lanka, the Philippines as well as Macau all registered double-digit growth during this 1995 to 2002 period. As quotas for these developing countries expanded from 1998 to 2001, the first phase of the displacement of imports from the United States took place. Canada’s clothing imports from the United States dropped by nearly one-quarter, or $200 million, during this period to $600 million. Bangladesh capitalizes on restraint-free access to Canadian marketOn January 1, 2003, clothing from many of the world’s least developed countries3 was extended quota-free, duty-free access to the Canadian market. This secured an advantage for these countries, since other competitors (notably China) still had the majority of their clothing products covered by quotas until the end of 2004 and faced 16% tariff rates. As a result, imports from these countries soared in 2003 and 2004 to $649 million, triple their value in 2002. In these two years, clothing imports from least developed countries posted a larger percentage gain than even China. Within the group, Bangladesh was the big winner. Canada’s clothing imports from Bangladesh hovered around $440 million in 2004 and 2005, up from $135 million in 2002. In 20064, the value of clothing imports from Bangladesh edged past imports from the United States, putting them just behind China as Canada’s second largest source for clothing products. Bangladesh now accounts for 7% of Canada’s clothing imports. Figure 5
Soaring imports from China displaced most other countries…Since joining the WTO in 2002, our clothing imports from China increased by nearly $1.8 billion, an 86% increase. This contrasts with a $0.8 billion drop for clothing imports from all other countries. China’s share of Canada’s total clothing supply (which is comprised of imports as well as Canadian clothing manufacturing for the domestic market) has increased five-fold, from 6% in 1995 to 31% in 2005. It is second only to Canadian clothing manufacturers, who continue to supply 32% of the domestic market. Figure 6
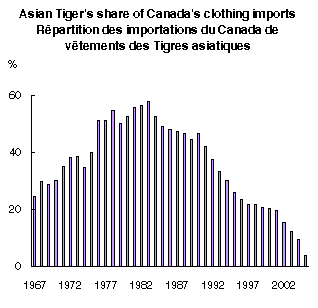
In the years leading up to 1995, Canadian companies imported about half a billion dollars worth of clothing products from China. Until 2002, the volume of imports allowed by quotas grew according to the tenets of the Multi-Fibre Arrangement. Canadian demand for China’s exports to Canada was strong enough to ensure quotas were exhausted each year. Then in December 2001, China became a member of the World Trade Organization. This meant that in 2002, China’s quotas expanded for the first time according to the WTO Agreement on Textiles and Clothing. And as of December 31, 2004, all quotas on China’s clothing exports to Canada were eliminated. The result: by 2005, imports from China hit $3.0 billion, which was nearly $2.5 billion greater than those from the United States or Bangladesh and twice China’s 2002 value. This was a 47% increase over 2004 in nominal terms, an increase of nearly $1.0 billion. In 1995, China accounted for only 15% of Canada’s clothing imports; at the end of 2001, its share had grown to 23%. China’s biggest jump in the share of our clothing imports occurred in 2005, when the percentage surged to 46% from just 33% in 2004. As the Canadian clothing market continued to shift to China as well as to Bangladesh, India and Mexico, our clothing imports from south of the border fell dramatically. Between 1998 and 2005, the value of American imports tumbled to $482 million. As a result, the United States’ share of our total clothing imports plunged to 9% in 2004 and 7% in 2005. Their overall share of the Canadian clothing market declined to 5%. As of September 2006, clothing imports from the United States stood at $350 million, 6% lower than 2005 and behind both China and Bangladesh. Imports from Hong Kong, South Korea and Taiwan, collectively referred to as the Asian Tigers, also took a hit. After falling from $1.2 billion in 1989 to $800 million in 1994, clothing imports from Hong Kong, South Korea and Taiwan then got a boost from the Agreement on Textiles and Clothing, once again reaching the $1.0 billion mark. However, once China had acceded to the WTO in 2002, the clothing industries in these countries shrivelled, with total clothing exports to Canada falling to $200 million. Figure 7
From a peak of supplying 58% of Canada’s clothing imports in 1983 and 30% as recently as 1989, the Asian Tigers’ share has dwindled to 4% of clothing imports in 2005. … although a few remain competitiveBangladesh, India and Mexico stand out as three developing countries that have not seen their exports collapse in the latter years of the Agreement’s implementation period, although their performance in recent years is in stark contrast to their growth of over 20% in most years up until 2002. Canada’s imports of clothing from India were about $200 million in 1995. As quotas expanded, Canadian demand for India’s clothing products doubled, peaking at $412 million in 2003. India’s imports fell slightly in 2004 and were stable in 2005, a resilience that has not been demonstrated by other developing countries. In 2005, India was the fourth larger exporter of clothing to Canada. The North American Free Trade Agreement (NAFTA), which came into effect in 1994, offered Mexico the advantage of lower tariffs and quota-free trade in supplying Canadian importers. In 2004, Mexico shipped $350 million worth of clothing to Canada, ten times its level in 1995. As a result, Mexico’s share of Canada’s import market in clothing jumped from 1% to 6% in 2004. Canada’s imports from Mexico dipped 3% in 2005, lowering its share of our import market to 5%. While Mexico retains its advantages of lower tariffs and proximity to the Canadian market over competitors, it is unclear whether these advantages are sufficient for Mexico to hang on to fifth place in the more liberalized trade environment. As for Bangladesh, clothing imports in 2005 inched down to $440 million, resulting in a slight narrowing of import share from 7.3% to 6.7%. But as of September 2006, imports are up 8% year-over-year. Similar to Mexico, Bangladesh clothing products continue to have the advantage of entering the Canadian market duty-free. Canadian production fell as US and domestic demand declinedExports to the United States fell from $2.5 billion in 20015 to $1.8 billion in 2005. The liberalization of trade in clothing with China was concentrated during this period since China was not a WTO member until December 2001 and thus not able to participate in the quota removal before then. The rapid appreciation of the Canadian dollar vis-à-vis the US dollar may have contributed to this decline, as it raised the relative price of Canadian clothing at a time when US importers were offered easy access to cheaper clothing products. By 2001, Canadian products served less than half of the Canadian clothing market: by 2005, imports supplied 68%, while domestic production accounted for the remaining 32% of the Canadian market. The drop in exports to the United States hurt Canadian production, but the larger contributor to the drop was decreased domestic demand for Canadian products, as retailers turned to imported products. While Canadian production for the domestic market fell about $400 million over 2000 and 2001, the largest drops occurred from 2002 to 2005. In these final three years of the liberalization period, the value of ‘made in Canada’ products destined for the Canadian market fell by $1.8 billion to $3.0 billion. Overall, Canadian production in clothing fell from $7.9 billion in 2000 to $7.5 billion in 2002 and then to $5.0 billion in 2005, a total decline of $2.5 billion. As trade liberalization took effect, the loss of the export market to the United States accounted for about 30% or $700 million, of the decline in overall production: the shift to foreign producers of clothing in the Canadian market accounted for remaining 70%. Figure 8
Employment rose in the 1990s and then fellAs noted earlier, during the 1990s, employment in the clothing industry rose by nearly 20,000, and peaked at 94,450 employees in 2001. This steady growth was a result of the rapid gains in exports to the United States, which peaked at $2.7 billion in 2000 and were stable in 2001. Figure 9
This employment growth from 1995 to the end of 2001 indicates that Canadian companies did not begin adjusting employment until the third phase (2002) of the Agreement on Textiles and Clothing. Between 2002 and 2005, employment in the clothing industry dropped by about 34,000, falling to about 60,000. Clothing production is based in Quebec and Ontario, although some manufacturing does occur in Manitoba, Alberta and British Columbia. Companies in Quebec accounted for about 60% of the drop in employment, those in Ontario about 23% and those in British Columbia about 5%. Between the 2002 employment peak and 2005, employment in Quebec fell by about 20,000, leaving 33,000 employed in the clothing industry in 2005. The Ontario clothing industry employed 24,500 in 2001. By 2005, this had dropped by 8,000 to 16,500. At its peak, the clothing industry in British Columbia employed 6,500 people. However, in 2005, the industry employed 4,800 people, a loss of 1,700.6 Clothing prices and trade liberalizationClothing prices in Canada steadily increased during the 1980s and 1990s, and then stabilized upon entering the new millennium. Canadians were paying 20% more for their clothing in 1999 than ten years earlier. Starting in 2002, when Canadian importers turned to China and Bangladesh, clothing prices have fallen steadily. Consumer prices were 5.8% lower in 2005 than they were in 2001. In examining whether the this drop in price can be attributed to trade liberalization, it is notable that a large appreciation in the Canadian dollars vis-à-vis the American dollar also occurred during the 2002 to 2005 period. But only around 10% of Canada’s clothing imports originated in the US, so the impact on clothing prices as a result of this exchange rate shift may not be large. The pull on clothing prices would be more likely to be affected by the resulting appreciation of the Canadian dollar vis-à-vis the Chinese yuan, which is tied to the US dollar. Figure 10
The United States’ clothing market has undergone a similar transformation to Canada in terms of China’s increasing share and domestic producers’ falling share.7 The populations of the United States and Canada have similar tastes for clothing and large clothing retailers that sell in one of the countries more often than not sell in both countries. It then follows that the US CPI offers an indication of price declines without the exchange rate being a factor. Between the end of 2001 and the end of 2005, clothing prices as measured by the American CPI dropped 6.5%, suggesting that the price declines were related to the trade liberalization, not simply the dollar appreciation. The removal of quotas contributed to the price decline by allowing Canadian importers to source products in the quantities desired from the best fit company, regardless of which country the company was based. In addition to lower prices due to removing all of the quotas on clothing, tariff levels on clothing products have declined. As noted earlier, in 1995, average tariffs on clothing stood at 21.5%. In 2005, these tariffs had declined to 14.7%. Also of note is that the United States invoked safeguard restraints at the end of 2005, which allowed them to maintain quotas on China’s clothing exports. These safeguard restraints were permitted under China’s WTO accession agreement of December 2001. As a result, US clothing prices in 2006 are edging up from 2005 levels. In contrast, Canadian clothing prices continue to fall, while the Canadian dollar was stable, leaving more dollars in our ‘made all over the world’ pockets. ConclusionMost people have come to associate Canada’s trade in clothing with increased imports from China. This paper has shown that the dynamics of trade liberalization are much more complex. Canadian producers initially profited from the introduction of free trade with the US, raising output and employment during the 1990’s. Then, trade liberalization gradually allowed increased imports from less-developed countries outside of China. With the extension of this liberalization to China when it entered the WTO late in 2001 and the removal of the remaining restraints on trade in recent years, China’s share of the Canadian market has soared. This has been at the expense of imports from other countries, although some remain competitive (such as India, Bangladesh and Mexico). As well, domestic producers have paid a stiff price in terms of lower production and jobs, although consumers have benefited from lower prices. Notes
|
|
|
|