Introduction
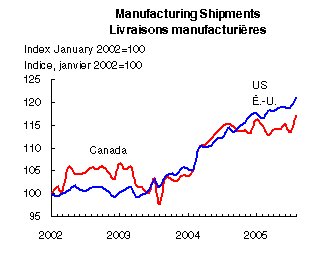
For the past year, manufacturers have been somewhat pessimistic about their future, as shipments and orders stagnated while inventories piled-up. At first glance, Canada’s manufacturing shipments fared much worse than those of their American counterparts (Figure 1).
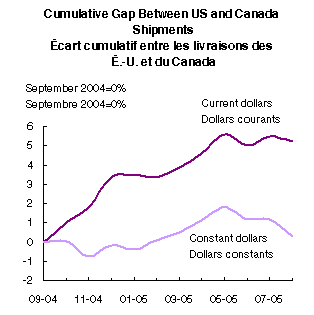
From September 2004 (when the divergence began) to August 2005, the gap between the growth in United States and Canadian shipments was 5.2 percentage points with current dollar shipments up 5.5% in the US but only 0.3% in Canada. In total, 14 of 21 industries contributed to this divergence. The most important contributions were recorded for transportation equipment, wood products, petroleum, chemicals and food, some of Canada’s largest manufacturing industries.
Figure 1

This article explores reasons for the divergence in shipments and examines which industries are contributing to it and whether Canadian shipments are really lagging after adjusting for price changes. As well, it looks at whether a divergence in unfilled orders affected the growing gap in shipments.
Gap mainly due to prices
Much of the gap between the growth of shipments in Canada and the United States over the past year is due to differences in the prices of manufactured goods as they leave the factory gate. In constant dollars, when the effect of prices is eliminated, the growth in Canadian shipments closely matched the pace set south of the border (Figure 2). The gap between the volume of US and Canadian shipments is practically nil (only 0.3 percentage points). In fact, constant dollar shipments in Canada outperformed the United States in 11 of 21 industries.
Figure 2

Prices related to the exchange rate
The exchange rate affects the price of goods sold abroad by Canadian manufacturers. The recent appreciation of the Canadian dollar has resulted in lower Canadian producer prices. Figure 3 shows how producer prices have been closely tied to the exchange rate.
Figure 3

Manufacturers export close to half of all shipments. Industries that export a large portion of their shipments include motor vehicles, machinery, pulp and paper, and wood products. Prices for these goods are usually quoted in US dollars. Since these Canadian manufacturers get paid in US greenbacks, they received fewer Canadian dollars for their US dollars when the exchange rate rose. While earnings were falling, the cost of Canadian inputs remained the same (except for imported investment goods).
Since the spread in prices was due to the exchange rate and the value of shipments depends on the prices of the goods shipped, current dollar shipments were very sensitive to movements in the dollar (Figure 4).
Figure 4

With the rising dollar, Canadian manufacturers also faced stiffer competition on the foreign market as their products were more expensive. Throughout the mid-1990s, a low dollar increased the demand for Canadian-made goods by making imported goods more expensive while making exports cheaper for foreigners. With the low dollar favouring Canadian manufacturers, the gap in shipments fell steadily. The Canadian dollar finally bottomed out in January 2002 when it reached 62.49 cents per U.S. dollar. Since 2003, the Canadian dollar appreciated.
The role of price differences in explaining the gap in shipments was especially significant for autos, wood product, and petroleum and coal products.
Autos
Autos had the largest impact on the overall gap in shipments. Differences in producer prices between the United States and Canada explains 95% of the gap in transportation equipment shipments. Motor vehicle manufacturing, the main contributor, is highly export-oriented with 86% of its shipments destined for export in August. Excluding motor vehicles, the gap in the growth of total shipments would have been 4.3% instead of 5.2%.
From September 2004 to August 2005, the dollar value of transportation equipment shipments grew 2.2% in the United States, while in Canada shipments dropped 4.1% (Table 1). However, in constant dollars, the gap between US and Canadian shipments was negligible, with both up slightly.
Wood products
Wood was the second largest contributor to the gap in shipments, accounting for 0.8 points of the 5.2% gap. Most manufacturers of wood products are price takers, selling their goods in highly competitive markets at US dollar prices.
From September 2004 to August 2005, prices received for lumber were down 14.6% in Canada compared with only 0.8% in the United States. The gap between the growth in US and Canadian shipments of wood products was 11.2%. Without the wood industry, the total gap in the growth of shipments would have been 4.4%.
However, in constant dollars, US shipments were down 1.8%, while Canadian shipments increased, driven by demand from the booming construction industry.
Table 1: Growth in shipments by industry, September 2004 to August 2005
| |
Current dollars |
Constant dollars |
Price contribution to the overall gap1 |
| Industry |
United States |
Canada |
Gap |
United States |
Canada |
Gap |
| |
|
|
|
|
|
|
% |
| Manufacturing |
5.5 |
0.3 |
5.2 |
0.7 |
0.4 |
0.3 |
85.4 |
| Food |
2.9 |
-2.8 |
5.7 |
2.0 |
-0.2 |
2.2 |
7.8 |
| Beverage and tobacco |
3.8 |
4.0 |
-0.2 |
-0.3 |
2.0 |
-2.4 |
0.9 |
| Textiles |
-8.6 |
-4.3 |
-4.3 |
-10.3 |
-5.0 |
-5.3 |
0.2 |
| Textile products |
2.6 |
-2.7 |
5.3 |
-0.6 |
-3.9 |
3.4 |
0.2 |
| Clothing |
0.2 |
-11.5 |
11.7 |
0.3 |
-11.3 |
11.7 |
0.0 |
| Leather |
-4.4 |
-18.5 |
14.1 |
-5.0 |
-18.9 |
13.9 |
0.0 |
| Paper |
1.1 |
-3.3 |
4.4 |
-1.4 |
-0.1 |
-1.3 |
5.0 |
| Printing |
-3.8 |
0.1 |
-3.9 |
-5.6 |
-0.7 |
-4.9 |
0.4 |
| Petroleum and coal |
30.2 |
21.0 |
9.2 |
-0.2 |
-1.0 |
0.8 |
11.8 |
| Chemical |
4.4 |
-3.0 |
7.4 |
-2.2 |
-5.8 |
3.6 |
7.0 |
| Plastics and rubber |
5.1 |
0.2 |
4.9 |
-1.0 |
-2.7 |
1.7 |
2.7 |
| Wood |
-2.6 |
-13.7 |
11.2 |
-1.8 |
1.0 |
-2.8 |
12.0 |
| Non-metallic minerals |
9.6 |
4.0 |
5.6 |
3.6 |
1.2 |
2.4 |
1.3 |
| Primary metals |
0.3 |
1.3 |
-1 |
-2.0 |
1.6 |
-3.7 |
3.0 |
| Fabricated metals |
2.5 |
2.4 |
0.2 |
-1.6 |
2.3 |
-3.9 |
4.8 |
| Machinery |
5.1 |
6.2 |
-1 |
1.8 |
5.0 |
-3.3 |
2.5 |
| Computer products |
7.5 |
9.0 |
-1.5 |
8.9 |
12.3 |
-3.4 |
2.1 |
| Electrical equipment |
5.4 |
2.4 |
3.0 |
1.7 |
-0.2 |
1.9 |
0.4 |
| Transportation |
2.2 |
-4.1 |
6.3 |
0.4 |
0.5 |
-0.1 |
22.4 |
| Furniture |
6.9 |
8.8 |
-1.8 |
3.3 |
6.7 |
-3.4 |
0.7 |
| Miscellaneous |
11.4 |
8.8 |
2.6 |
9.8 |
7.6 |
2.2 |
0.2 |
| 1. The analysis makes use of a decomposition technique splitting the gap in the growth of shipments into three factors (price, quantity and weight). |
|
Although the volume of shipments was up slightly, the large drop in Canadian wood prices had a significant impact on the profit earned by wood product manufacturers. Recent reports of losses and plunging profits in the forest industry blame lower prices, the stronger dollar and increased energy, labour and raw material costs. Profits for the wood manufacturing industry were down 27% in the past year.
Petroleum
Strong global demand and supply constraints coupled with refinery shutdowns as a result of the hurricanes in the Gulf of Mexico have recently caused oil prices to surge. Although Canadian refineries were not directly affected by the natural disasters that hit the United States, petroleum prices in Canada are heavily influenced by prices in the United States due to the integrated nature of the North American petroleum product market. From September 2004 to August 2005, petroleum product prices increased 30.5% in the US and 22.3% in Canada.
Consequently, the value of US petroleum and coal shipments increased 30.2% over the past year, while in Canada it increased 21.0%, a gap of 9.2%. Constant dollar shipments have remained relatively stable over the course of the year, with a gap of only 0.8%.
Computer industry is more important to the US
While price differences were the largest factor, structural differences explain most of the remainder of the gap in the growth of shipments. The relative weight of particular industries played a role, particularly for computer and electronic products. If computers and electronics were as important in Canada as in the US, the gap in shipments would have been reduced.
In September 2004, the computer industry accounted for 9% of US factory shipments, compared to only 3% in Canada. Computer and electronic equipment is a high growth industry on both sides of the border, with constant dollar shipments up 8.9% from September 2004 to August 2005 in the United States compared with 12.2% in Canada. Although shipments grew faster in Canada, they contributed less to total shipments overall, since the industry is now a relatively small player here.
Unfilled orders
While shipments have been diverging for the past year, unfilled orders in the US have increased relative to Canadian orders since early 2003. Unfilled orders are the backlog or stock of orders that will generate future shipments, assuming they are not cancelled. For this reason, unfilled orders are sometimes used to forecast future manufacturing activity. To facilitate the comparison of unfilled orders, we look only at selected durable goods industries.
From January 2003 to August 2005, unfilled orders of selected durable goods increased 24.0% in the United States, but decreased 5.2% in Canada, a gap of 29.2% (Figure 5). Transportation equipment explains a large part of this gap.
Figure 5

However, unlike shipments which are driven by autos, the aerospace industry dominates unfilled orders in transportation equipment. US unfilled orders for aircraft, buoyed by demand for defence aircraft and from the red-hot Asian travel industry, were up 17.6% over the period, while they were down 24.2% in Canada. Although it contributed heavily to the gap in the growth of unfilled orders, the aerospace industry does not explain the gap in the growth in shipments because of the long lags in production. Overall, aerospace production contributes only 2% to total manufacturing shipments.
Profits
While overall shipment volumes are keeping up with those in the US, one area where Canada’s factories are lagging is in profits. From their low in 2002 to 2004, manufacturing profits increased 191% in the United States compared to only 19% in Canada. This largely reflects the severe squeeze on prices from the stronger dollar.
Figure 6

Conclusion
Because much of Canada’s manufactured output is exported, the exchange rate and differences in the price of manufactured goods are key to explaining the gap in the growth rate of shipments. When comparing constant dollar shipments, the difference in the growth of US and Canadian shipments is virtually eliminated. Although growth in the total value of shipments has lagged, growth in shipment volumes is keeping up with the United States.
Recent feature articles
|


