Feature article
National versus Domestic Output: A Measure of Economic Maturity?
by P. Cross*
Recently, The Economist1 suggested that the ratio of GNI to GDP reflects a country’s ‘economic maturity’. Nations such as Switzerland, Britain and the US all have a GNI larger than GDP because of their past investments abroad. Countries such as Ireland, which depend on large inflows of foreign investment to finance their development, have a smaller GNI than GDP.
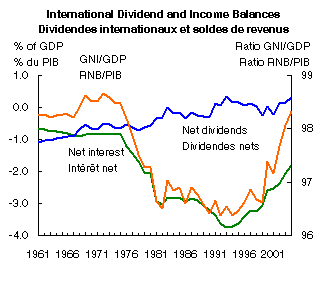
Since 1998, Canada’s GNI has grown a cumulative 2 percentage points more than its GDP (37.4% versus 35.6%). While this may not seem significant, in dollar terms Canadians would have received $16.4 billion less income if GNI had grown only as fast as GDP, equivalent to $512 for every Canadian. As a result, the ratio of GNI to GDP has risen from 96% to 98%. Based on recent trends, Canada’s GNI could outstrip its GDP for the first time on record before the end of the current decade.
Figure 1

Gross domestic product (GDP) measures the total value of output within Canada’s borders over a given period of time, irrespective of whether the labour or capital producing it is Canadian or not. It is more closely related to employment, which counts jobs in a country irrespective of nationality. Gross national income (GNI, the aggregate formerly known as GNP) measures the income earned by Canadians or Canadian-owned capital anywhere in the world. This is done by adding to GDP investment income (mostly interest and dividends) earned by Canadians on their investments outside Canada and deducting investment income paid to non-residents.
The difference between GDP and GNI reflects some of the fundamentals of an economy’s structure. In the US, GNI is slightly higher than GDP ($11.06 trillion versus $11.0 trillion). This reflects the continuing high yield on the large stock of American investment abroad built up after World War II. This allows Americans to spend more than their domestic output would support. The difference is relatively small, however, as these international investment flows are dwarfed by the enormous size of their domestic economy. Conversely, GNI in a small open economy such as Ireland was 15% below GDP, reflecting the large outflow of investment income from foreign-owned companies. The implication is that Ireland has less money to spend than GDP would indicate. But GDP is still an important statistic, since it measures the volume of output, which is a better indicator of the demand for jobs in Ireland, and presumably other variables such as prices and interest rates.
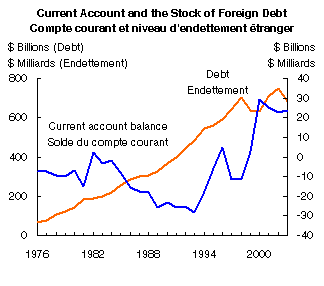
Figure 2

Canada’s rise in GNI relative to GDP in recent years initially reflected the surge in our direct investment abroad, which in the early 1990s began to exceed foreign direct investment in Canada. More recently, a pay-down of our international debt has reinforced this trend (figure 2).
The rest of this paper looks at the separate contributions of dividends and interest to changes in international investment incomes.
Dividends
An earlier paper2 showed that dividend flows switched from a net outflow for all of our recorded history to a net inflow for the first time ever in 1991. This mirrored Canada’s sharp shift from being a net recipient of foreign direct investment to being a net supplier of direct investment abroad. The book value of Canadian stock holdings and direct investment abroad exceeded foreign investment in Canada by the mid-1990s. This was the impulse behind the reversal in dividend flows in Canada’s favour.
This process persisted into 2004. The net flow of dividends into Canada rose to $ 3.4 billion at annual rates so far in 2004. The driving force continued to be our ever-expanding stock of direct investment abroad, which reached a new high of $447 billion in 2004, reflecting both a large war chest of surplus corporate funds from surging profits and a rising Canadian dollar (which increases the purchasing power of investors making investments or takeovers outside of Canada).
Figure 3

The increase in dividend receipts from abroad by Canadians has been propelled by the growing level of investments abroad and not by a rising dividend yield. In fact, this yield (measured by dividend receipts divided by the stock of investments) has been relatively stable at about 4% over the years.
Conversely, dividend outflows from Canada have fallen in recent years. The main reason was again slower growth in foreign direct investment in Canada, not a change in dividend yields. The recent appreciation of the Canadian dollar discourages foreign investment, since it reduces the purchasing power of foreign investors in Canada (especially Americans, whose currency has fallen the most). The sharp rise of the loonie in 2004 suggests this deterrent will continue to be significant.
Since 1990, net dividends have increased by $5.5 billion to a net inflow of $3.4 billion, or 0.4% of GDP. In terms of net investment income, the improvement in dividend flows early in the 1990s was outweighed by the deterioration in interest income. As a result, GNI lagged behind GDP, hitting its low of 96.4 in 1994. Since then, continued slow gains in the balance for dividends were reinforced by a rapid turnaround in interest payments after 1998. This produced the sharp rise in GNI relative to GDP in recent years.
Interest
In 1961, net dividend outflows were the largest part (1.1 points) of the 1.8% shortfall between GNI and GDP. But starting in the 1970s, net interest payments became the main source of the net outflow of investment income. This reflected our burgeoning external debt, compounded by interest rates exceeding 20% in the early 1980s (figure 4 and 5).
Figure 4

Figure 5

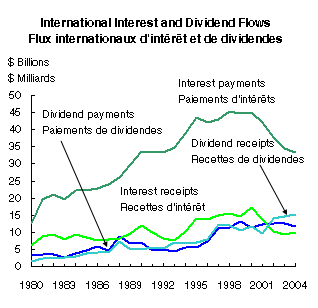
The larger contribution of the interest balance than dividends to the improvement in Canada’s international investment flows reflects the much larger amount of our interest payments. Dividend payments and receipts and interest receipts are all slightly over $10 billion. But at their peak in 1998 interest payments at $45 billion were larger than the other three combined. Even with a 24% drop in interest payments since then to $3.1 billion, they still approximate the combined total of the other three. The sharp drop in interest payments in recent years has done the most to close the gap between GNI and GDP.
Figure 6

Two factors have driven interest payments down so rapidly since 1998. First, the value of our interest-bearing debt began to decline after 1998 (this debt includes foreign-held bonds, short-term securities, deposits and other liabilities). Second, the interest rates paid on this debt have fallen.
Starting in the 1990s, Canada’s indebtedness to foreigners has reversed dramatically. From its peak in 1998, our borrowing has fallen 2,2%. This reflected consistently large current account surpluses. While growing surpluses in merchandise trade led this turnaround, the falling stock of foreign debt and lower interest rates also reduced the burden of servicing the debt after 1997. As well, both the federal and provincial governments have paid-off foreign debts faster than domestic debt.
Figure 7 shows the effective interest rate for debt owed by Canada and foreign debt held by Canadians. The effective rate is calculated by dividing interest payments by the stock of debt outstanding.3 The average interest rate we paid to non-residents rose steadily to a peak of nearly 11% in the early 1980s (while interest rates on new debt issued were occasionally over 20%, the average interest rate paid was held down by lower rates on previously issued debt as well as lower rates for things such as ordinary deposits). Since then, the average interest rate has fallen steadily, with a particularly sharp decline from 7% to 5% after 2000 when interest rates tumbled around the world.
Figure 7

Since 1980, the average interest rate Canada receives from foreign assets has fallen faster than the interest rate we paid. This implies that the drop in our net external debt has been more important than relative interest rate movements in improving our balance in interest flows. But the larger stock of our debt owed to non-residents also implies that every drop in interest rates would reduce payments faster than receipts, also leading to an improved net interest account.
Canadians have consistently paid more interest on our debt to foreigners than we have received on debt owed by non-residents. Partly this reflects the different structure of these debts. More of the debt we owe has been in the form of bonds, and more of these bonds were issued during the high interest era of the 1970s and 1980s (they increased $177 billion over these two decades). Conversely, deposits were the leading source of our lending to non-residents in the 1970s and 1980s, and these have lower rates than bonds. Canadians did not begin to buy large amounts of foreign bonds until the 1990s. Then our holdings jumped from less than $10 billion to $45 billion, even as bond yields fell to the lowest level in a generation. As a result, the average interest rate received by Canadians was just under 3% last year, its lowest since 1964. This raised the gap between the average interest rate for payments and receipts to 2.2 points, its largest in nearly four decades. As well, provinces in Canada borrow more in foreign markets, and they pay a higher interest rate than the federal government.
The net result of lower interest payments to foreigners and more interest received by Canadians was an $8.2 billion drop in net interest outflows since 1999. Not only did this raise GNI relative to GDP, but it also had a growing impact on our net national worth. The reduction in foreign debt servicing contributed one-quarter of the 7.8% increase in wealth over the past year, up from its 15% contribution in the previous five years.
In terms of the increase in GNI relative to GDP since 1998, interest payments have contributed almost two-thirds, with the rest coming from dividends. This is important because the amounts of money involved in debt are still larger than direct investment. As well, interest payments are a more stable source of income than dividends, since they cannot be stopped (barring bankruptcy) while dividends can be suspended anytime business conditions sour (although in aggregate dividend flows have been fairly stable except during recessions4).
International Trends
Figure 8 is a scatter diagram of the relationship between GNI relative to GDP for 84 countries by stage of development (as measured by GDP per capita in 2001)5. Most less-developed countries have a smaller GNI than GDP. The exceptions were some very poor countries such as Bangladesh, Pakistan, Nepal and Jordan, reflecting the near-absence of foreign investment in these countries and a large number of migrant workers abroad. But as per capita incomes rise beyond $5000, most developing countries quickly settle into a range between 90 and 100 for the ratio of GNI to GDP, as more foreign investment results in a net outflow of interest and dividends. Most East European and Latin American countries, as well as China and other Southeast Asian Nations, fall in this category. Korea is an exception, with its policy of discouraging foreign investment and relying on its chaebols for growth.
Figure 8 |

Starting at about $15,000 per capita, the ratio of GNI to GDP rises in tandem with GDP per capita. Canada, Australia, and Italy are in a group just below a cluster of more mature nations such as Germany, France and Britain, whose GNI about equals GDP. Ireland is very much an exception in having GNI well below GDP, reflecting its heavy reliance on foreign investment for its recent rapid growth. As a result, while Ireland’s GDP per capita matches Canada, the Irish do not live as well as Canadians. Several of the richest countries—the US, Japan and Switzerland—have a larger GNI than GDP. Switzerland has the highest ratio at 106, as consistently large trade surpluses allowed it to build up a stock of foreign investment abroad greater than its own GDP.6 One exception is Norway, where GNI is slightly below GDP after foreign investors developed its oilfields.
An interesting feature about Canada is that GNI was close to GDP until the 1970s. Dividend outflows were the major drag on GNI, reflecting our reliance on foreign investment in the post-war period. But the sharp drop in GNI relative to GDP in the 1970s and 1980s originated in a large build-up of our foreign debt. Now that this debt is falling, Canada has returned to the higher ratio of GNI to GDP more typical of developed nations.
Table 1: International Investment Flows, 1990-2004 ($000,000)
|
| |
Dividends |
|
Interest |
|
Total* |
| |
Receipts |
Payments |
Balance |
|
Receipts |
Payments |
Balance |
|
Receipts |
Payments |
Balance |
| |
|
|
|
|
|
|
|
|
|
|
|
| 1990 |
4,829 |
6,932 |
-2,103 |
|
11,862 |
33,733 |
-21,871 |
|
16,827 |
41,271 |
-24,444 |
| 1991 |
5,582 |
4,753 |
829 |
|
10,039 |
33,249 |
-23,210 |
|
15,812 |
38,666 |
-22,854 |
| 1992 |
5,404 |
4,941 |
463 |
|
8,092 |
33,474 |
-25,382 |
|
13,662 |
39,059 |
-25,397 |
| 1993 |
6,958 |
4,452 |
2,506 |
|
7,534 |
34,700 |
-27,166 |
|
14,641 |
39,810 |
-25,169 |
| 1994 |
6,623 |
5,439 |
1,184 |
|
10,164 |
38,859 |
-28,695 |
|
16,898 |
44,892 |
-27,994 |
| 1995 |
7,085 |
5,693 |
1,392 |
|
14,128 |
43,466 |
-29,338 |
|
21,357 |
49,907 |
-28,550 |
| 1996 |
7,902 |
7,280 |
622 |
|
13,602 |
42,174 |
-28,572 |
|
21,672 |
50,002 |
-28,330 |
| 1997 |
12,283 |
11,142 |
1,141 |
|
14,773 |
43,071 |
-28,298 |
|
27,257 |
54,961 |
-27,704 |
| 1998 |
11,858 |
11,545 |
313 |
|
15,396 |
45,236 |
-29,840 |
|
27,207 |
57,627 |
-30,420 |
| 1999 |
10,599 |
13,026 |
-2,427 |
|
14,542 |
44,766 |
-30,224 |
|
25,324 |
58,556 |
-33,232 |
| 2000 |
11,756 |
11,268 |
488 |
|
17,244 |
45,085 |
-27,841 |
|
29,143 |
57,175 |
-28,032 |
| 2001 |
9,736 |
12,205 |
-2,469 |
|
13,888 |
42,023 |
-28,135 |
|
23,748 |
55,121 |
-31,373 |
| 2002 |
13,983 |
12,491 |
1,492 |
|
10,179 |
37,801 |
-27,622 |
|
24,230 |
51,164 |
-26,934 |
| 2003 |
14,682 |
12,614 |
2,068 |
|
9,485 |
34,516 |
-25,031 |
|
24,281 |
47,951 |
-23,670 |
| 2004** |
15,115 |
11,760 |
3,355 |
|
9,993 |
33,435 |
-23,442 |
|
25,267 |
46,871 |
-21,604 |
| * The total includes interest, dividends and financial
services. |
| ** At annual rates. |
Recent feature articles
* For more information on international investment income, contact D. Caron, Balance of Payments (613) 951-1861.
1 See “Measure for measure” in The Survey of Ireland, The Economist, Oct. 16, 2004.
2 P. Cross, “The Effect of Dividend Flows on Canadian Incomes.” Canadian Economic Observer (Catalogue
no. 11-010), Oct. 2002.
3 Using data from Canada's International Investment Position..
4 For example, dividend receipts fell in 1990 and 2001 when the US slipped into recession. The US accounts for 41% of the stock of our direct investments abroad.
5 The output per capita data for 2003 are from the World Bank, using purchasing power parities (www.worldbank.org/data/databytopic/GNIPC.pdf). The GNI/GDP data are from The United Nations, National Accounts Statistics: Main Aggregates and Detailed Tables, 2001, Part I and II (UN, NY, 2003). The graph excludes three countries: two had extreme values of the ratio of GNI to GDP: Lesotho (125) and Kuwait (115), while Luxembourg had a large GDP per capita of $54,000.
6 From “Overseas earnings lift the standard of living” p. 8, Financial Times, Nov. 24, 2004. |


