
National Household Survey: Aboriginal Peoples
Response mobility and the growth of the Aboriginal identity population, 2006-2011 and 2011-2016
by Vivian O’Donnell and Russell LaPointe
Skip to text
Text begins
Introduction
The AboriginalNote population in Canada is growing at a remarkable pace. Between 2011 and 2016, the Aboriginal identity population increased 19.5%, compared to a 4.2% increase in the non-Aboriginal population. Growth in the previous census period of 2006 to 2011 was also significant; the Aboriginal identity population increased 19.8% while the non-Aboriginal population increased 5.2%. What can account for this growth? While birth rates in the Aboriginal population have remained relatively high,Note there are non-demographic factors to consider.Note This study examines response mobility, which refers, in this context, to the phenomenon by which people provide different responses over time to census questions about Indigenous identity.
Response mobility (or ethnic mobilityNote ) has been observed in several countries, including Australia, the United States and New Zealand.Note It has been identified as a factor of growth in the Aboriginal identity population in Canada for several decades.Note This study builds upon this work by using an integrated dataset that includes census information up to the 2016 Census.
Several factors may contribute to response mobility. Previous researchNote about the Aboriginal identity population has found that having a certain degree of mixed ancestry can be correlated with response mobility. Social factors, legislative changes and court decisions can also have an impact on the way that people respond to census questions. The census form is usually filled in by one person on behalf of all members of a household, and different people may have filled in the form from one Census to the next. A respondent may have newly discovered Aboriginal ancestry and is now identifying as an Aboriginal person. Changes to the question wording or instructions on the questionnaire may influence the way that respondents answer. Even when wording stays the same, the way that people perceive the census categories may evolve and change over time.
Understanding response mobility is important because of its potential impacts on the size, composition and characteristics of the Aboriginal identity population. This study examines the patterns of response mobility to the Aboriginal identifier questions from 2006 to 2011 and 2011 to 2016. It first outlines how the Aboriginal population is counted in the Census and then describes the integrated Census dataset that is used as the data source for this analysis. Patterns of response mobility are presented at the national level for the total Aboriginal identity population to show the magnitude of “exchange” between the Aboriginal and non-Aboriginal populations. More detailed information is then provided about “movement” between the different Aboriginal identity groups and the non-Aboriginal population. Regional analysis is also provided, looking at net response mobility in the provinces and territories.
The Aboriginal identity population
How is the Aboriginal population measured in the Census? Table 1 summarizes the Aboriginal identifier questions on the census questionnaire that are used to derive the Aboriginal identity population. Included in the Aboriginal identity population are those who self-identify as an Aboriginal person (that is, First Nations, Métis or Inuit) in Question 18 and/or who report being a Status Indian and/or a member of a First Nation/Indian band in Questions 20 and 21. As such, the Aboriginal identity population, as a concept, is a mix of self-identification and legal status. While the questions used to create the Aboriginal identity population in 2011 and 2016 were the same, there were changes from 2006 to 2011. A notable one was the 2011 addition of the term “First Nations” to Question 18 with the accompanying note that “First Nations (North American Indian) includes Status and Non-Status Indians” (Table 1).
Table 1 start
| Census 2006 – 2B (Long Form) | 2011 NHS: N1 questionnaire and Census 2A-L-2016 (long form questionnaire) |
|---|---|
| 18. Is this person an Aboriginal person, that is, North American Indian, Métis or Inuit (Eskimo)? If “Yes”, mark “X” the circle(s) that best describe(s) this person now. |
18. Is this person an Aboriginal person, that is, First Nations (North American Indian), Métis or Inuk (Inuit)? Note: First Nations (North American Indian) includes Status and Non-Status Indians. If “Yes”, mark “X” the circle(s) that best describe(s) this person now. |
| 21. Is this person a Treaty Indian or a Registered Indian as defined by the Indian Act of Canada? | 20. Is this person a Status Indian (Registered or Treaty Indian as defined by the Indian Act of Canada)? |
| 20. Is this person a member of an Indian Band / First Nation? | 21. Is this person a member of a First Nation/Indian band? If “Yes”, which First Nation/Indian band? For example, Musqueam Indian Band, Sturgeon Lake First Nation, Atikamekw of Manawan. |
| Sources: Statistics Canada. Questionnaires from the 2006 Census, the 2011 National Household Survey, and the 2016 Census are available on Statistics Canada’s website at https://www12.statcan.gc.ca/census-recensement/2016/ref/index-eng.cfm (accessed October 9, 2019). | |
Table 1 end
In this paper, the Aboriginal identity population is divided into the First Nations, Métis and Inuit population groups (based on single responses to question 18). Using responses to question 20, the First Nations population is further divided into those who reported being a Status Indian (First Nations Status Indians) and those who reported that they were not a Status Indian (First Nations Non-Status Indians). The category ‘Other’ captures the rest of the Aboriginal identity population: those who identified with more than one Aboriginal group and those who did not identify as First Nations, Métis or Inuit but who indicated being a Status Indian and/or a member of a First Nation/Indian band. The ‘Other’ category comprises a relatively small part of the population, and most of the analysis will focus on First Nations Status Indians, First Nations Non-Status Indians, Métis, and Inuit (Table 2).
Table 2 start
| Census year | Aboriginal identity group | |||||
|---|---|---|---|---|---|---|
| First Nations Status Indians |
First Nations Non-Status Indians |
Métis | Inuit | OtherTable 2 Note 1 | Total Aboriginal identity population | |
| number | ||||||
| 2006 | 563,670 | 132,645 | 388,465 | 50,345 | 34,310 | 1,169,435 |
| 2011 | 637,660 | 213,900 | 451,795 | 59,440 | 37,890 | 1,400,685 |
| 2016 | 744,855 | 232,375 | 587,545 | 65,025 | 43,980 | 1,673,785 |
Sources: Statistics Canada, censuses of population 2006 and 2016; 2011 National Household Survey. |
||||||
Table 2 end
Data source
This analysis is based on the integration of records from the 2006 Census, the 2011 National Household Survey (NHS) and the 2016 Census, which allows users to retrieve the same respondent’s information at different points in time. In this study, responses of individuals to the 2006 Census are compared to their responses in the 2011 NHS, and the responses of individuals in the 2011 NHS are compared to their responses in the 2016 Census.Note
It is important to note that only those living in private dwellings who were respondents in both census years could be included. Therefore, excluded from the dataset are those who were younger than the age of 5 in the second census period, individuals who migrated to Canada between cycles, individuals who died or left Canada between cycles, and individuals who lived in a collective dwelling in either census period. The integrated dataset is weighted to represent the total Canadian population according to these eligibility criteria. For the 2011-2016 integrated dataset, the sum of weights represents the Canadian population in 2011 who was still alive and present in Canada in 2016. For the 2006-2011 integrated dataset, the sum of weights represents the total Canadian population in 2006 who was still alive and present in Canada in 2011. Using the weighted counts from the integrated dataset, percent distributions were calculated.
There was “flow” both into and out of the Aboriginal identity population in both census periods
Using the integrated dataset, responses of individuals to the Aboriginal identifier questions can be tracked from one census period to the next to see if the responses of individuals remained ‘consistent’ or if their responses changed (indicating response mobility). Chart 1 summarizes the movement or ‘flow’ both into and out of the Aboriginal identity population at the national level.
Of the 2011 Aboriginal population in the integrated dataset, 83.2% would go on to identify as Aboriginal in 2016. The remaining 16.8% would flow out of the Aboriginal population into the non-Aboriginal population in 2016 (Chart 1). Those who identified as Aboriginal in both 2011 and 2016, that is, the consistent flow, represented 75.4% of the 2016 Aboriginal population. The remainder is accounted for by the inflow of individuals from the non-Aboriginal population into the Aboriginal population. About one in four (24.6%) of the 2016 Aboriginal population in the integrated dataset had identified as non-Aboriginal in 2011.
Chart 1 start

Data table for Chart 1
| 2011 | 2016 | |
|---|---|---|
| percent | ||
| Aboriginal | 83.2 | 75.4 |
| Non-Aboriginal | 16.8 | 24.6 |
| Total | 100.0 | 100.0 |
| Source: Statistics Canada, 2011 National Household Survey; 2016 Census integration. | ||
Chart 1 end
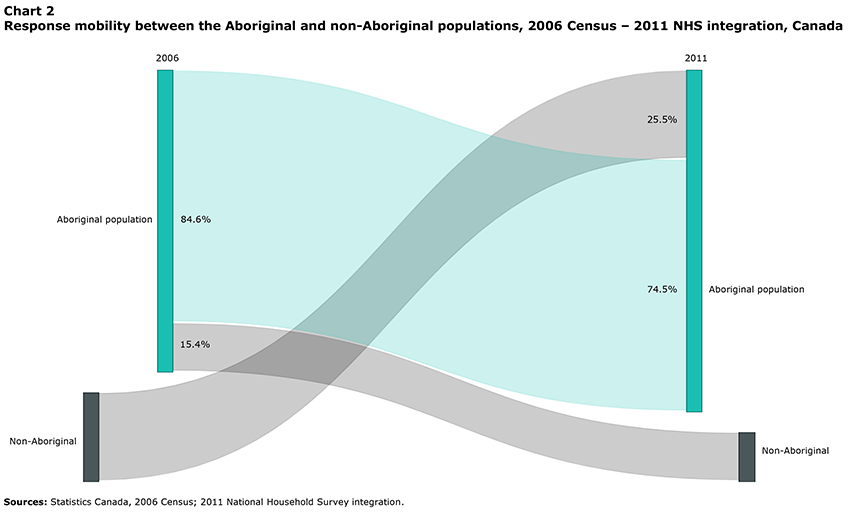
The patterns were similar in the previous census period of 2006 to 2011. Of the 2006 Aboriginal identity population, 84.6% went on to identify as Aboriginal in 2011. The remaining 15.4% flowed out of the Aboriginal population into the non-Aboriginal population (‘outflow’). The consistent flow represented 74.5% of the Aboriginal identity population in 2011, with 25.5% of the 2011 Aboriginal identity population in the integrated dataset previously identifying as non-Aboriginal. (Chart 2)
Chart 2 start
Data table for Chart 2
| 2006 | 2011 | |
|---|---|---|
| percent | ||
| Aboriginal | 84.6 | 74.5 |
| Non-Aboriginal | 15.4 | 25.5 |
| Total | 100.0 | 100.0 |
| Source: Statistics Canada, 2006 Census; 2011 National Household Survey integration. | ||
Chart 2 end
Charts 1 and 2 illustrate the “movement” of respondents between the Aboriginal and non-Aboriginal populations at the national level in the two census periods being considered (2011 to 2016 and 2006 to 2011), as some individuals flowed out of the Aboriginal population while others flowed in. In both census periods, the number of people flowing in outnumbered those flowing out, resulting in a net gain in the population. Using the integrated dataset, it is possible to consider more detailed flow patterns. The next section examines response mobility between different Aboriginal population groups and the non-Aboriginal population.
Response mobility was highest in the First Nations Non-Status Indian population and the Métis population
Chart 3 illustrates “flow” patterns between First Nations Status Indians, First Nations Non-Status Indians, Métis, Inuit and the non-Aboriginal population from 2011 to 2016. Response mobility is more prevalent in the Métis and First Nations Non-Status Indian populations, and less prevalent in the First Nations Status Indian and Inuit populations. While there is flow between the Aboriginal identity groups (for example, movement from First Nations Non-Status to Métis), much of the “exchange” occurs with the non-Aboriginal population.
Chart 3 start

Data table for Chart 3
| 2011 identity group | 2016 identity group | Percent |
|---|---|---|
| First Nations Status Indians | First Nations Status Indians | 33.6 |
| First Nations Status Indians | First Nations Non-Status Indians | 0.6 |
| First Nations Status Indians | Métis | 0.6 |
| First Nations Status Indians | Inuit | 0.0 |
| First Nations Status Indians | Other | 0.3 |
| First Nations Status Indians | Non-Aboriginal | 0.7 |
| First Nations Non-Status Indians | First Nations Status Indians | 1.7 |
| First Nations Non-Status Indians | First Nations Non-Status Indians | 3.6 |
| First Nations Non-Status Indians | Métis | 1.4 |
| First Nations Non-Status Indians | Inuit | 0.0 |
| First Nations Non-Status Indians | Other | 0.2 |
| First Nations Non-Status Indians | Non-Aboriginal | 4.9 |
| Métis | First Nations Status Indians | 1.0 |
| Métis | First Nations Non-Status Indians | 1.0 |
| Métis | Métis | 16.9 |
| Métis | Inuit | 0.0 |
| Métis | Other | 0.4 |
| Métis | Non-Aboriginal | 6.2 |
| Inuit | First Nations Status Indians | 0.1 |
| Inuit | First Nations Non-Status Indians | 0.0 |
| Inuit | Métis | 0.0 |
| Inuit | Inuit | 2.8 |
| Inuit | Other | 0.0 |
| Inuit | Non-Aboriginal | 0.2 |
| Other | First Nations Status Indians | 0.5 |
| Other | First Nations Non-Status Indians | 0.1 |
| Other | Métis | 0.4 |
| Other | Inuit | 0.0 |
| Other | Other | 0.2 |
| Other | Non-Aboriginal | 1.2 |
| Non-Aboriginal | First Nations Status Indians | 1.8 |
| Non-Aboriginal | First Nations Non-Status Indians | 5.8 |
| Non-Aboriginal | Métis | 12.4 |
| Non-Aboriginal | Inuit | 0.2 |
| Non-Aboriginal | Other | 1.1 |
|
Notes: The percent distribution was calculated using the total population that had identified as Aboriginal in either census period. Only percentages greater than or equal to 1% are displayed. Sources: Statistics Canada, 2011 National Household Survey; 2016 Census integration. |
||
Chart 3 end
Response mobility between Aboriginal groups can be examined by first considering the “outflow” from different population groups; in other words, looking at how the people in each Aboriginal population group in 2011 went on to identify in 2016 (Table 3A). Among those who identified as First Nations Status Indians in 2011, 94.0% provided the same response in 2016. The remaining 6% moved into the other population groups (2.0% into the non-Aboriginal population and 4.0% into the other Aboriginal population groups). Inuit also had a relatively high percentage of consistent responses. Of those who reported being Inuit in 2011, 89.9% reported the same way in 2016. The remainder moved into the non-Aboriginal population (6.2%) or into the other Aboriginal population groups (3.9%).
Of those who reported being Métis in 2011, two thirds (66.3%) reported the same way in 2016 while one quarter (24.3%) identified as non-Aboriginal in 2016. Another 7.7% moved into the First Nations population, distributed fairly evenly between Status and Non-Status Indian populations (Table 3A).
The percentage of Non-Status Indians moving into the non-Aboriginal population was relatively high. Of those who reported being First Nations Non-Status Indians in 2011, 41.2% moved into the non-Aboriginal population in 2016. Another 14.5% moved into the First Nations Status Indian population, and 12.2% identified as Métis. Less than a third (30.0%) of those in the 2011 First Nations Non-Status Indian population reported the same way in 2016. (Table 3A)
Table 3a start
| 2016 identity group | 2011 identity group | ||||
|---|---|---|---|---|---|
| First Nations Status Indians |
First Nations Non-Status Indians |
Métis | Inuit | Other | |
| percent | |||||
| First Nations Status Indians | 94.0 | 14.5 | 3.7 | 1.8 | 19.7 |
| First Nations Non-Status Indians | 1.6 | 30.0 | 4.0 | 0.4 | 6.1 |
| Métis | 1.6 | 12.2 | 66.3 | 1.2 | 15.1 |
| Inuit | 0.1 | 0.2 | 0.1 | 89.9 | 0.7 |
| Other | 0.7 | 2.0 | 1.6 | 0.5 | 8.7 |
| Non-Aboriginal | 2.0 | 41.2 | 24.3 | 6.2 | 49.7 |
| Total | 100.0 | 100.0 | 100.0 | 100.0 | 100.0 |
|
Note: Percentages may not add up to 100 due to rounding. Source: Statistics Canada, 2011 National Household Survey; 2016 Census integration. |
|||||
Table 3a end
Table 3B shows the “inflow” from different population groups; in other words, it shows how individuals in each Aboriginal population group in 2016 had identified in 2011. Over half (52.4%) of the 2016 First Nations Non-Status Indian population in the integrated dataset had reported being non-Aboriginal on the previous census (Table 3B). There was also a significant inflow from the non-Aboriginal population to the 2016 Métis population. Of those who identified as Métis in 2016, 39.1% had identified as non-Aboriginal in 2011.
Table 3b start
| 2011 identity group | 2016 identity group | ||||
|---|---|---|---|---|---|
| First Nations Status Indians |
First Nations Non-Status Indians |
Métis | Inuit | Other | |
| percent | |||||
| First Nations Status Indians | 87.1 | 5.1 | 1.8 | 0.8 | 12.0 |
| First Nations Non-Status Indians | 4.5 | 32.0 | 4.6 | 0.6 | 10.8 |
| Métis | 2.5 | 9.1 | 53.3 | 0.5 | 18.7 |
| Inuit | 0.1 | 0.1 | 0.1 | 91.0 | 0.7 |
| Other | 1.2 | 1.3 | 1.1 | 0.5 | 9.2 |
| Non-Aboriginal | 4.6 | 52.4 | 39.1 | 6.6 | 48.6 |
| Total | 100.0 | 100.0 | 100.0 | 100.0 | 100.0 |
| Source: Statistics Canada, 2011 National Household Survey; 2016 Census integration. | |||||
Table 3b end
The patterns of response mobility were similar in both census periods (2011-2016 and 2006-2011)
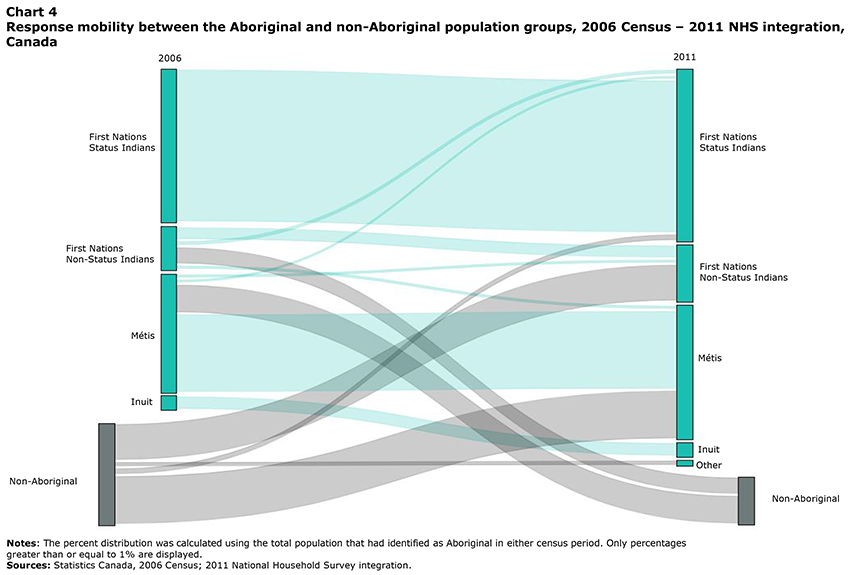
The general patterns of response mobility at the national level from 2006 to 2011 largely mirror the results from 2011 to 2016 (Chart 3). When considering how each Aboriginal population group in 2006 identified in 2011 (the “outflow”), First Nations Status Indians and Inuit had the highest percentage of consistent responses (93.0% and 93.2% respectively), while 65.9% of Métis and 31.9% of First Nations Non-Status Indians consistently identified. As in the other census period, there was a considerable “outflow” from the Métis and First Nations Non-Status Indian populations into the Non-Aboriginal population. About one quarter (24.5%) of the 2006 Métis population in the integrated dataset went on to identify as non-Aboriginal in 2011, while 41.5% of the 2006 First Nations Non-Status Indian population did so. (Table 4A)
When considering how each Aboriginal population group in 2011 had identified in 2006 (the “inflow”), significant movements from the non-Aboriginal population into the First Nations Non-Status Indian and Métis populations are observed. Of the First Nations Non-Status Indian population in the integrated dataset in 2011, 61.6% had reported being non-Aboriginal on the previous Census. Of those who identified as Métis in 2011, 35.6% had identified as non-Aboriginal in 2006. (Table 4B)
Chart 4 start
Data table for Chart 4
| 2006 identity group | 2011 identity group | Percent |
|---|---|---|
| First Nations Status Indians | First Nations Status Indians | 33.5 |
| First Nations Status Indians | First Nations Non-Status Indians | 0.7 |
| First Nations Status Indians | Métis | 0.8 |
| First Nations Status Indians | Inuit | 0.0 |
| First Nations Status Indians | Other | 0.2 |
| First Nations Status Indians | Non-Aboriginal | 0.8 |
| First Nations Non-Status Indians | First Nations Status Indians | 1.3 |
| First Nations Non-Status Indians | First Nations Non-Status Indians | 3.1 |
| First Nations Non-Status Indians | Métis | 1.2 |
| First Nations Non-Status Indians | Inuit | 0.0 |
| First Nations Non-Status Indians | Other | 0.1 |
| First Nations Non-Status Indians | Non-Aboriginal | 4.0 |
| Métis | First Nations Status Indians | 1.1 |
| Métis | First Nations Non-Status Indians | 1.1 |
| Métis | Métis | 17.3 |
| Métis | Inuit | 0.1 |
| Métis | Other | 0.3 |
| Métis | Non-Aboriginal | 6.5 |
| Inuit | First Nations Status Indians | 0.0 |
| Inuit | First Nations Non-Status Indians | 0.0 |
| Inuit | Métis | 0.0 |
| Inuit | Inuit | 3.2 |
| Inuit | Other | 0.0 |
| Inuit | Non-Aboriginal | 0.1 |
| Other | First Nations Status Indians | 0.7 |
| Other | First Nations Non-Status Indians | 0.2 |
| Other | Métis | 0.3 |
| Other | Inuit | 0.0 |
| Other | Other | 0.3 |
| Other | Non-Aboriginal | 0.7 |
| Non-Aboriginal | First Nations Status Indians | 1.7 |
| Non-Aboriginal | First Nations Non-Status Indians | 8.3 |
| Non-Aboriginal | Métis | 10.8 |
| Non-Aboriginal | Inuit | 0.3 |
| Non-Aboriginal | Other | 1.4 |
|
Notes: The percent distribution was calculated using the total population that had identified as Aboriginal in either census period. Only percentages greater than or equal to 1% are displayed. Sources: Statistics Canada, 2006 Census; 2011 National Household Survey integration. |
||
Chart 4 end
Table 4a start
| 2011 identity group | 2006 identity group | ||||
|---|---|---|---|---|---|
| First Nations Status Indians |
First Nations Non-Status Indians |
Métis | Inuit | Other | |
| percent | |||||
| First Nations Status Indians | 93.0 | 13.6 | 4.1 | 0.7 | 32.2 |
| First Nations Non-Status Indians | 2.0 | 31.9 | 4.3 | 1.2 | 10.1 |
| Métis | 2.3 | 12.1 | 65.9 | 1.1 | 13.9 |
| Inuit | 0.1 | 0.1 | 0.3 | 93.2 | 1.1 |
| Other | 0.6 | 0.8 | 1.0 | 0.3 | 12.7 |
| Non-Aboriginal | 2.1 | 41.5 | 24.5 | 3.4 | 30.1 |
| Total | 100.0 | 100.0 | 100.0 | 100.0 | 100.0 |
|
Note: Percentages may not add up to 100 due to rounding. Source: Statistics Canada, 2006 Census; 2011 National Household Survey integration. |
|||||
Table 4a end
Table 4b start
| 2006 identity group | 2011 identity group | ||||
|---|---|---|---|---|---|
| First Nations Status Indians |
First Nations Non-Status Indians |
Métis | Inuit | Other | |
| percent | |||||
| First Nations Status Indians | 87.5 | 5.3 | 2.7 | 0.5 | 10.3 |
| First Nations Non-Status Indians | 3.4 | 22.8 | 3.8 | 0.2 | 3.3 |
| Métis | 2.8 | 8.4 | 56.9 | 1.9 | 11.5 |
| Inuit | 0.1 | 0.3 | 0.1 | 88.7 | 0.5 |
| Other | 1.8 | 1.6 | 1.0 | 0.7 | 12.3 |
| Non-Aboriginal | 4.4 | 61.6 | 35.6 | 8.0 | 62.1 |
| Total | 100.0 | 100.0 | 100.0 | 100.0 | 100.0 |
|
Note: Percentages may not add up to 100 due to rounding. Source: Statistics Canada, 2006 Census; 2011 National Household Survey integration. |
|||||
Table 4b end
These national-level findings reveal different patterns of response mobility for the different Aboriginal groups. For both census periods (2006 to 2011 and 2011 to 2016) the First Nations Status Indian population and the Inuit population had higher percentages of consistent responses, and the First Nations Non-Status Indian population and the Métis had lower percentages of consistent responses. While all Aboriginal identity groups experienced an outflow of individuals into the non-Aboriginal population, all groups experienced an inflow from the non-Aboriginal population. For all groups, this resulted in a net gain. This exchange with the non-Aboriginal population was particularly prevalent in the First Nations Non-Status Indian population and the Métis population.
These national-level results can mask substantial regional variation. The next section considers response mobility in the Aboriginal identity populations in the provinces and territories.
Response mobility was more common in provinces east of Manitoba
Response mobility impacts the growth of the Aboriginal identity population differently across the country. One way to get a better understanding of regional differences is to calculate a net response mobility for the Aboriginal identity population in each province and territory. Net response mobility is estimated by subtracting the number of individuals who no longer reported an Aboriginal identity from the number who began reporting an Aboriginal identity. A positive net mobility indicates that more people began reporting an Aboriginal identity response than stopped reporting it, indicating a net positive effect of response mobility on the growth of the population of interest.Note To facilitate comparisons between provinces and territories, net response mobility between two census years for a given province or territory is expressed as a percentage of the Aboriginal population in the first census year in that province or territory.
From 2011 to 2016, there was a positive net response mobility of 10.4% at the national level for the Aboriginal identity population (Table 5). Higher net response mobility rates were observed in the provinces east of Manitoba, with the highest net response mobility rate in Nova Scotia (49.7%). The other Atlantic provinces also had net response mobility rates that were higher than the national rate. Quebec had a net response mobility of 21.7% while Ontario (which had the largest Aboriginal identity population of all the provinces and territories) had a net response mobility of 14.2% (Table 5).
By contrast, each of the Western provinces had relatively low net response mobility. Saskatchewan had the lowest net response mobility of any province or territory between 2011 and 2016 at 0.1%. Manitoba (5.2%), Alberta (5.0%) and British Columbia (7.2%) had rates below the national average. Of the three territories, Yukon had the highest net response mobility at 9.0%, while rates in the Northwest Territories and in Nunavut were both less than 1%. (Table 5)
Table 5 start
| Region | Aboriginal identity population | Net response mobility rate of Aboriginal identity population | |||
|---|---|---|---|---|---|
| Census year | Census period | ||||
| 2006 | 2011 | 2016 | 2006-2011 | 2011-2016 | |
| number | percent | ||||
| Canada | 1,169,435 | 1,400,690 | 1,673,785 | 13.6 | 10.4 |
| Newfoundland and Labrador | 23,390 | 35,800 | 45,725 | 48.2 | 27.4 |
| Prince Edward Island | 1,725 | 2,230 | 2,735 | Note x: suppressed to meet the confidentiality requirements of the Statistics Act | 25.7 |
| Nova Scotia | 24,115 | 33,850 | 51,490 | 42.9 | 49.7 |
| New Brunswick | 17,585 | 22,620 | 29,385 | 27.7 | 25.0 |
| Quebec | 108,095 | 141,915 | 182,890 | 27.6 | 21.7 |
| Ontario | 241,840 | 301,430 | 374,395 | 21.0 | 14.2 |
| Manitoba | 174,575 | 195,895 | 223,310 | 5.8 | 5.2 |
| Saskatchewan | 141,830 | 157,740 | 175,015 | 3.0 | 0.1 |
| Alberta | 187,935 | 220,695 | 258,640 | 7.4 | 5.0 |
| British Columbia | 195,400 | 232,290 | 270,585 | 12.9 | 7.2 |
| Yukon | 7,540 | 7,710 | 8,195 | 10.0 | 9.0 |
| Northwest Territories | 20,525 | 21,160 | 20,860 | 0.1 | 0.6 |
| Nunavut | 24,875 | 27,360 | 30,555 | 0.9 | 0.4 |
|
x suppressed to meet the confidentiality requirements of the Statistics Act Notes: Census counts are provided for context only and do not reflect the population in the integrated dataset. Census counts have not been adjusted for incompletely enumerated reserves. The net response mobility rate was calculated by subtracting the number of people who stopped reporting being Aboriginal from the number of people newly reporting being Aboriginal as a percentage of the total Aboriginal population from the previous period. Sources: Statistics Canada, Censuses of population 2006 and 2016; 2011 National Household Survey; and the 2006 Census; 2011 National Household Survey; 2016 Census integration. |
|||||
Table 5 end
These patterns were similar to that of the previous census period of 2006 to 2011. At a national level, the net response mobility for the Aboriginal identity population was 13.6%. The Atlantic provinces had the highest net response mobility rates in the country, with Newfoundland and Labrador having the highest rate (48.2%) of all the provinces and territories. The Western provinces had lower net response mobility rates than their eastern counterparts. Saskatchewan (3.0%) had the lowest rate of all of the provinces, while Manitoba (5.8%) and Alberta (7.4%) were also below the national average. Response mobility had little effect on the size of the Aboriginal identity populations in the Northwest Territories (0.1%) and Nunavut (0.9%).
Table 5 shows the Census and NHS Aboriginal identity population counts in each province and territoryNote . When considering the impact of response mobility on the growth of the Aboriginal identity population in the provinces and territories, it is important to consider the size of these populations. While the Atlantic provinces experienced the greatest percentage change, these provinces had relatively small populations to start with.
Conclusion
The Aboriginal identity population has been growing at a rate that far outpaces the growth of the non-Aboriginal population. While demographic factors such as high birth rates are contributing to this growth,Note this study examined a non-demographic factor of growth: specifically response mobility to the Aboriginal identifier questions from 2006 to 2011 and from 2011 to 2016. The study highlights “flows” both into and out of the Aboriginal identity population. In both census periods, those who “entered” the Aboriginal population outnumbered those who “left”. Further, it highlights how response mobility impacts upon some Aboriginal identity groups more than others. Specifically, the First Nations Non-Status Indian and Métis populations had lower percentages of consistent responses than the First Nations Status Indian and Inuit populations. It also shows how response mobility varies across the country, with higher net response mobility rates in the Aboriginal identity population being observed in the provinces east of Manitoba.
Why would a respondent change their responses to the Aboriginal identifier questions on the Census over time? There are many possible reasons. Responses to the Aboriginal self-identification question (“Is this person an Aboriginal person, that is, First Nations, Métis or Inuk?”) may be influenced by many factors, including the respondents’ social environment, their understandings of their family history, and their understandings of the nature of First Nations, Métis and Inuit identity. Respondents may also be influenced by the perception that self-identification can lead to benefits for Aboriginal peoples in general, and for the individual personally.Note Other research has shown that response mobility in the Aboriginal identity population is more common in regions with lower Aboriginal representation in the population, such as urban areas.Note
Further, because the Aboriginal identity population concept is a mix of self-identification and legal status, changes in legislation can also have an impact. There have been some significant changes to the eligibility criteria for Registered Indian Status in the Indian Act in the time period being considered.Note For example, in 2011, the Qalipu Mi’kmaq First Nation in Newfoundland and Labrador was established as an Indian Band under the Indian Act. In the time leading up to its establishment and in the years following, there was a number of people who applied for band membership and registration as Status Indians. By August 2019, there were 22,573 Individuals who had successfully registered as Status Indians and members of the Qalipu First Nation.Note The total number of applications, however, was approximately 104,000.Note Over the 2006-2011 and 2011-2016 time periods, the net response mobility rate in Newfoundland and Labrador was among the highest of all provinces and territories in Canada.
Questionnaire changes can also lead to response mobility. For example, a recent study regarding ethnic origins found evidence that examples on the questionnaire can provide a boost to those origins which are included among the examples, compared to those which are not.Note In the case of the Aboriginal identifier questions, the term “First Nations” was introduced in Question 18 in 2011, along with the instruction note: “First Nations includes Status and Non-Status Indians.” (See Table 1) While this study did not specifically set out to measure the impact of the inclusion of this note, it is evident that there was an increase in the number of respondents reporting as First Nations Non-Status Indians. It may be that this note influenced more people without Registered Indian Status to report being First Nations.
While it is difficult to pinpoint precisely why a respondent might change their responses to the Aboriginal identifer questions over time, response mobility is an important phenomenon to understand. This study builds on previous studies and is designed to provide a foundation for understanding the impact of response mobility on the changing size, composition, and characteristics of the Aboriginal identity population between recent census periods. Future research will examine the demographic and socio-economic characteristics of respondents who “move” both into and out of the Aboriginal identity population compared to those who provide consistent responses. This will be done to help understand the effect of response mobility on measurements over time. For example, researchers, policy makers and policy evaluators may question to what extent observed differences in the economic and social conditions in the Aboriginal population between census periods are the result of actual changes within the population that took place over that five-year period, and how much is due to new additions to the Aboriginal population. By considering socio-economic characteristics of those who moved into and out of the Aboriginal population (such as education level, employment status, and income level), one can better discern the nature and magnitude of the impact of response mobility on socioeconomic characteristics.Note
Finally, it is important to note that while there may be some fluidity in reporting to the Aboriginal identifier questions, it is clear that Aboriginal identity concepts are meaningful. Unique socioeconomic, demographic and cultural characteristics of First Nations people (both status and non-status), Métis and Inuit are observed when compared to the non-Aboriginal population in each of the time periods examined.Note Studies on response mobility help contextualize and provide further insight into Aboriginal population growth and the changing characteristics of the Aboriginal identity population over time.
Methodology
The methodology used in this study is similar to that of a recent study which looked at changes in responses related to ethnic origin questions.Note To determine whether people changed their answers, data from the 2006 Census and 2011 NHS were integrated, and data from the 2011 NHS and 2016 Census were integrated. The subsamples for each integrated dataset consisted of anyone who had identified as Aboriginal in either census period being considered. The subsample from 2011 to 2016 included 180,857 respondents, and the subsample from 2006 to 2011 included 155,206 respondents. Each record was assigned a weight to provide estimates for changes in the total in-scope population. Limitations to the dataset include the fact that not everyone who answered in both census periods could be integrated. A second limitation is the possibility that two different people may have been incorrectly connected as part of the integration process. This can lead to the appearance of a change in response that did not actually occur. Any coverage or data quality issues with either cycle would also impact the integrated dataset. The estimates from the 2006 and 2016 Census long-form questionnaires were derived from a mandatory survey, while the estimates for the 2011 NHS were derived from a voluntary survey. All analysis is performed using percentages rather than frequencies. The weights for the integrated dataset were generated only for comparison and growth calculations, and not for frequencies.
Bibliography
Andersen, Chris. 2014. “Ethnic or Categorical Mobility? Challenging Conventional Demographic Explanations for Métis Population Growth.” Aboriginal Populations: Social, Demographic, and Epidemiological Perspectives. Frank Trovato and Anatole Romaniuk (eds.). Edmonton: University of Alberta Press. p. 263-284.
Australian Bureau of Statistics. 2012. Perspectives on Aboriginal and Torres Strait Islanders Identification in Selected Data Collection Contexts, Information Paper. Catalogue no. 4726.0.
Australian Bureau of Statistics. 2018. Census of Population and Housing: Understanding the Increase in Aboriginal and Torres Strait Islander Counts, 2016. Catalogue no. 2077.0.
Caron-Malenfant, Éric, Simon Coulombe, Eric Guimond, Chantal Grondin and André Lebel. 2014. “Ethnic Mobility of Aboriginal Peoples in Canada Between the 2001 and 2006 Censuses.” Population-E. 69 (1). p. 29-54.
Carter, Kristie N., et al. 2009.“How much and for whom does self-identified ethnicity change over time in New Zealand? Results from a longitudinal study.” Social Policy Journal of New Zealand, no. 36.
Guimond, Eric. 2003. “Fuzzy Definitions and Population Explosion: Changing Identities of Aboriginal Groups in Canada.” Not Strangers in These Parts: Urban Aboriginal Peoples. Government of Canada, Policy Research Initiative: 35-50.
Guimond, Eric. 1999. “Ethnic Mobility and the Demographic Growth of Canada’s Aboriginal Populations from 1986 to 1996,” Report on the Demographic Situation in Canada, 1998 and 1999, Statistics Canada, Catalogue no. 91-209.
Liebler, Carolyn A., Sonya R. Porter, Leticia E. Fernandez, James M. Noon and Sharon R. Ennis. 2017. “America’s Churning Races: Race and Ethnicity Response Changes Between Census 2000 and the 2010 Census”. Demography. Volume 54, Issue 1: 259-284.
Morency, Jean-Dominique, Éric Caron-Malenfant and David Daignault. 2018. “Fertility of Aboriginal People in Canada: An Overview of Trends at the Turn of the 21st Century.” aboriginal policy studies Vol. 7, no. 1: 34-61.
Perez Anthony, Hirschman Charles, 2009, “Estimating net interracial mobility in the United States: A residual methods approach”, Sociological Methodology, 39(1), p. 31-71.
Siggner, Andrew J. 2003. “Impact of ‘Ethnic Mobility’ on Socio-economic Conditions of Aboriginal Peoples.” Canadian Studies in Population. Vol. 30(1). p. 137-158.
Smith, Trevor and Scott McLeish. 2019. Technical report on changes in response related to the census ethnic origin question: Focus on Jewish origins, 2016 Census integrated with 2011 National Household Survey, Statistics Canada. Catalogue no. 89-857-X2019009.
Statistics Canada. 2015. Projections of the Aboriginal Population and Households in Canada, 2011 to 2036. Catalogue no. 91-552-X.
Statistics Canada. 2019. Aboriginal Peoples Technical Report: Census of Population 2016. Catalogue no. 98-307-X2016001.
Statistics New Zealand. 2015. National Ethnic Population Projections: 2013(base)–2038.
- Date modified: