
Infographic 2
Investment in non-residential building construction, June 2026
Infographic description
The title of the infographic is "Investment in non-residential building construction, June 2026"
The infographic includes multiple components, such as a map, tables, pictographs and images.
The text on the infographic, as well as the pie chart and map data, is as follows:
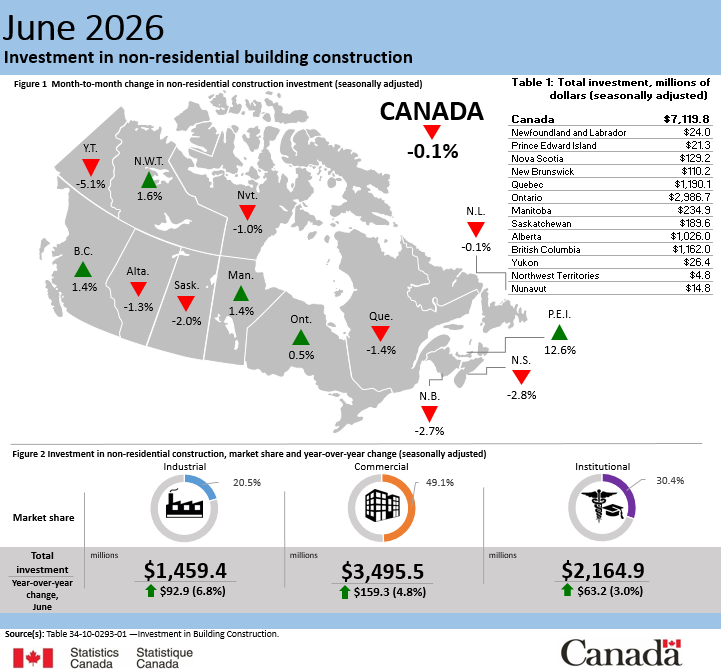
Figure 1: Month-to-month change in non-residential construction investment (seasonally adjusted).
This is a map of Canada by province and territory, showing the month-to-month percentage changes for investment in non-residential building construction. Green arrows pointing upward represent an increase, while red arrows pointing downward represent a decrease.
Investment in non-residential construction for Canada decreased 0.1% in June compared with May. Newfoundland and Labrador was down 0.1%, Prince Edward Island was up 12.6%, Nova Scotia was down 2.8%, New Brunswick was down 2.7%, Quebec was down 1.4%, Ontario was up 0.5%, Manitoba was up 1.4%, Saskatchewan was down 2.0%, Alberta was down 1.3%, British Columbia was up 1.4%, Yukon was down 5.1%, the Northwest Territories was up 1.6% and Nunavut was down 1.0%.
Table 1: Total investment, millions of dollars (seasonally adjusted).
Total investment for Canada was $7,119.8 million, total investment for Newfoundland and Labrador was $24.0 million, total investment for Prince Edward Island was $21.3 million, total investment for Nova Scotia was $129.2 million, total investment for New Brunswick was $110.2 million, total investment for Quebec was $1,190.1 million, total investment for Ontario was $2,986.7 million, total investment for Manitoba was $234.9 million, total investment for Saskatchewan was $189.6 million, total investment for Alberta was $1,026.0 million, total investment for British Columbia was $1,162.0 million, total investment for Yukon was $26.4 million, total investment for the Northwest Territories was $4.8 million and total investment for Nunavut was $14.8 million.
Figure 2: Investment in non-residential construction, market share and year-over-year change (seasonally adjusted).
Industrial: Market share was 20.5% and total investment totalled $1,459.4 million, representing a year-over-year increase of 6.8% or $92.9 million.
Commercial: Market share was 49.1% and total investment totalled $3,495.5 million, representing a year-over-year increase of 4.8% or $159.3 million.
Institutional: Market share was 30.4% and total investment totalled $2,164.9 million, representing a year-over-year increase of 3.0% or $63.2 million.
Source(s): Table 34-10-0293-01—Investment in Building Construction.
- Date modified: