
Map 1
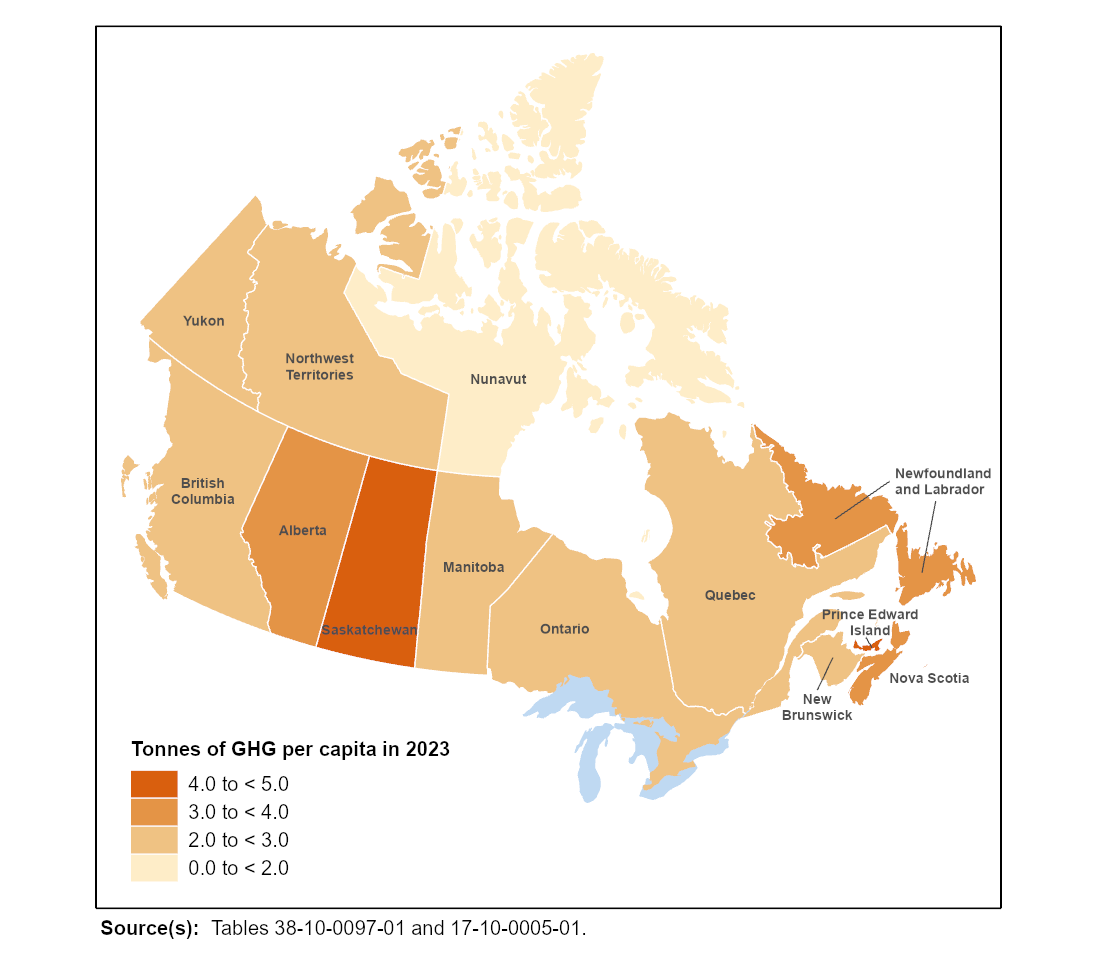
Household greenhouse gas (GHG) emissions per capita by province and territory, 2023
Map description
The title of the map is "Household greenhouse gas (GHG) emissions per capita by province and territory, 2023"
Provincial and territorial boundaries are outlined in white, with surrounding land masses and water bodies also coloured white, except for the Great Lakes, which are shaded blue. The Canadian provinces and territories and the Great Lakes are the only prominent geographic features included on the map. Each province and territory is labeled in black text, with the label either inside the larger provinces and territories or adjacent to the smaller provinces and territories. Newfoundland and Labrador, Prince Edward Island, New Brunswick and Nova Scotia all have a black leader line that connects the provincial labels to their geographic units.
The title of the legend in the bottom left corner is "Tonnes of GHG per capita in 2023" and displays four ranges of per capita emissions corresponding to a colour gradient that darkens as per capita emissions increase.
The lightest colour in the gradient is beige and corresponds to a range of emissions from 0.0 to less than 2.0. Nunavut is shaded beige.
Coral corresponds to a range of emissions from 2.0 to less than 3.0. New Brunswick, Quebec, Ontario, Manitoba, British Columbia, the Northwest Territories and Yukon are shaded coral.
Orange corresponds to a range of emissions from 3.0 to less than 4.0. Newfoundland and Labrador, Nova Scotia and Alberta are shaded orange.
Dark orange corresponds to a range of emissions from 4.0 to less than 5.0. Prince Edward Island and Saskatchewan are shaded dark orange.
Source(s): Tables 38-10-0097-01 and 17-10-0005-01.
- Date modified: