Infographic 1
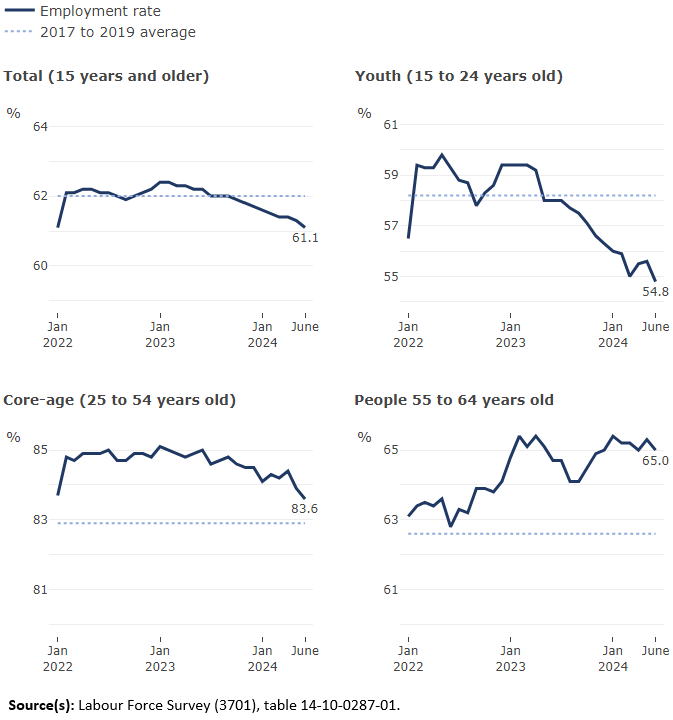
Employment rate continues downward trend for youth and core-aged people

Infographic description
The title of the infographic is "Employment rate continues downward trend for youth and core-aged people"
The infographic contains 4 charts.
The title of the first chart is "Total (15 years and older)"
This is a line chart.
The vertical axis shows the percent, from 60% to 64%, by increments of 2.
The horizontal axis shows the months January 2022, January 2023, January 2024, and June 2024.
There is one line in this chart to show the employment rate and a line to show the 2017 to 2019 average.
The employment rate is 61.1% for January 2022, 62.4% for January 2023, 61.6% for January 2024 and 61.1% for June 2024.
The 2017 to 2019 average is 62.0%.
The title of the second chart is "Youth (15 to 24 years old)"
This is a line chart.
The vertical axis shows the percent, from 55% to 61%, by increments of 2.
The horizontal axis shows the months January 2022, January 2023, January 2024, and June 2024.
There is one line in this chart to show the employment rate and a line to show the 2017 to 2019 average.
The employment rate is 56.5% for January 2022, 59.4% for January 2023, 56.0% for January 2024 and 54.8% for June 2024.
The 2017 to 2019 average is 58.2%.
The title of the third chart is "Core-age (25 to 54 years old)"
This is a line chart.
The vertical axis shows the percent, from 81% to 85%, by increments of 2.
The horizontal axis shows the months January 2022, January 2023, January 2024, and June 2024.
There is one line in this chart to show the employment rate and a line to show the 2017 to 2019 average.
The employment rate is 83.7% for January 2022, 85.1% for January 2023, 84.1% for January 2024 and 83.6% for June 2024.
The 2017 to 2019 average is 82.9%.
The title of the fourth chart is "People 55 to 64 years old"
This is a line chart.
The vertical axis shows the percent, from 61% to 65%, by increments of 2.
The horizontal axis shows the months January 2022, January 2023, January 2024, and June 2024.
There is one line in this chart to show the employment rate and a line to show the 2017 to 2019 average.
The employment rate is 63.1% for January 2022, 64.8% for January 2023, 65.4% for January 2024 and 65.0% for June 2024.
The 2017 to 2019 average is 62.6%.
Source(s): Labour Force Survey (3701), table 14-10-0287-01.
- Date modified: