Infographic 3
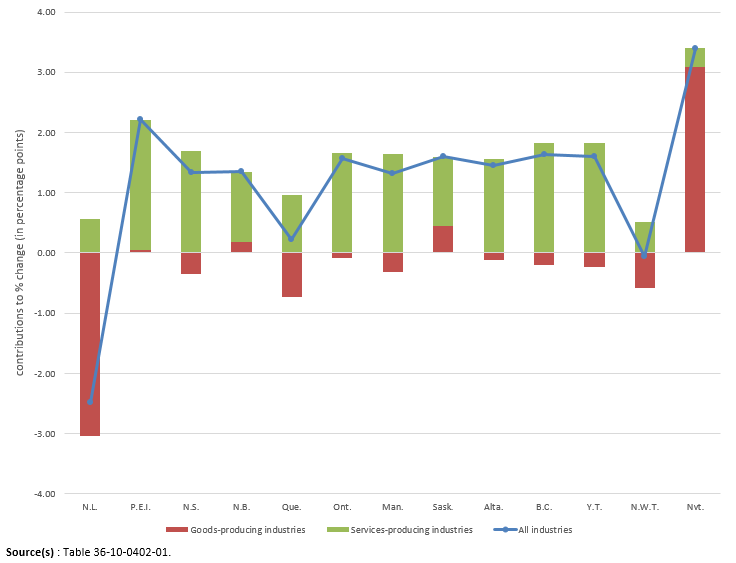
Contributions to percentage change of goods-producing industries and services-producing industries, provinces and territories, 2023

Infographic description
The title of the infographic is "Contributions to percentage change of goods-producing industries and services-producing industries, provinces and territories, 2023"
This is a combo chart showing the annual contributions (positive or negative) of real gross domestic product by industry in each province and territory. Goods-producing industries are represented by red stacked bars and services-producing industries are represented by green stacked bars. All industries growth is represented by a blue line with markers.
In Newfoundland and Labrador, goods-producing industries contributed -3.05 percentage points, services-producing industries contributed 0.56 percentage points, and all industries growth was -2.49%.
In Prince Edward Island, goods-producing industries contributed 0.05 percentage points, services-producing industries contributed 2.16 percentage points, and all industries growth was 2.21%.
In Nova Scotia, goods-producing industries contributed -0.36 percentage points, services-producing industries contributed 1.69 percentage points, and all industries growth was 1.34%.
In New Brunswick, goods-producing industries contributed 0.18 percentage points, services-producing industries contributed 1.17 percentage points, and all industries growth was 1.35%.
In Quebec, goods-producing industries contributed -0.73 percentage points, services-producing industries contributed 0.96 percentage points, and all industries growth was 0.23%.
In Ontario, goods-producing industries contributed -0.08 percentage points, services-producing industries contributed 1.66 percentage points, and all industries growth was 1.58%.
In Manitoba, goods-producing industries contributed -0.32 percentage points, services-producing industries contributed 1.65 percentage points, and all industries growth was 1.32%.
In Saskatchewan, goods-producing industries contributed 0.44 percentage points, services-producing industries contributed 1.16 percentage points, and all industries growth was 1.60%.
In Alberta, goods-producing industries contributed -0.11 percentage points, services-producing industries contributed 1.56 percentage points, and all industries growth was 1.45%.
In British Columbia, goods-producing industries contributed -0.19 percentage points, services-producing industries contributed 1.82 percentage points, and all industries growth was 1.63%.
In Yukon, goods-producing industries contributed -0.23 percentage points, services-producing industries contributed 1.83 percentage points, and all industries growth was 1.60%.
In the Northwest Territories, goods-producing industries contributed -0.58 percentage points, services-producing industries contributed 0.51 percentage points, and all industries growth was -0.07%.
In Nunavut, goods-producing industries contributed 3.09 percentage points, services-producing industries contributed 0.31 percentage points, and all industries growth was 3.40%.
Source(s): Table 36-10-0402-01.
- Date modified: