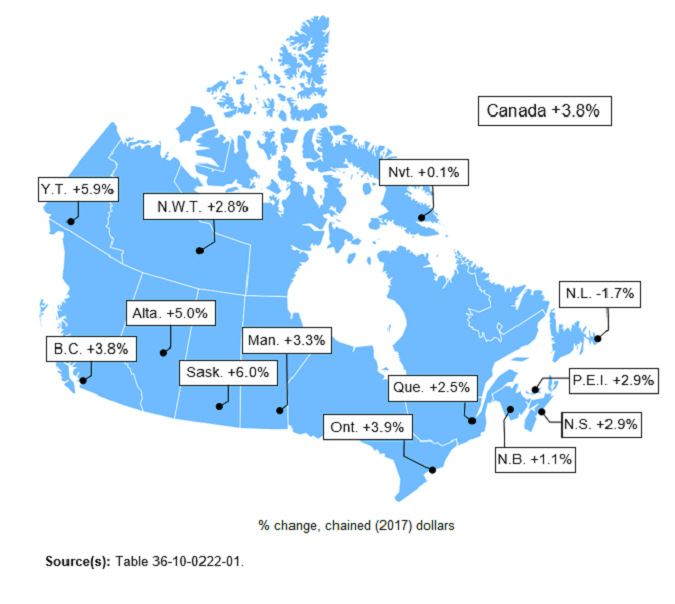
Map 1
Real gross domestic product in 2022

Map description
The title of the map is "Real gross domestic product in 2022"
This is a map of Canada by province and territory showing the year-over-year percentage changes, in chained (2017) dollars, in real gross domestic product in 2022.
Real gross domestic product was up 3.8% in Canada. It was down 1.7% in Newfoundland and Labrador, up 2.9% in Prince Edward Island, up 2.9% in Nova Scotia, up 1.1% in New Brunswick, up 2.5% in Quebec, up 3.9% in Ontario, up 3.3% in Manitoba, up 6.0% in Saskatchewan, up 5.0% in Alberta, up 3.8% in British Columbia, up 5.9% in Yukon, up 2.8% in the Northwest Territories and up 0.1% in Nunavut.
Source(s): Table 36-10-0222-01.
- Date modified: