Infographic 1
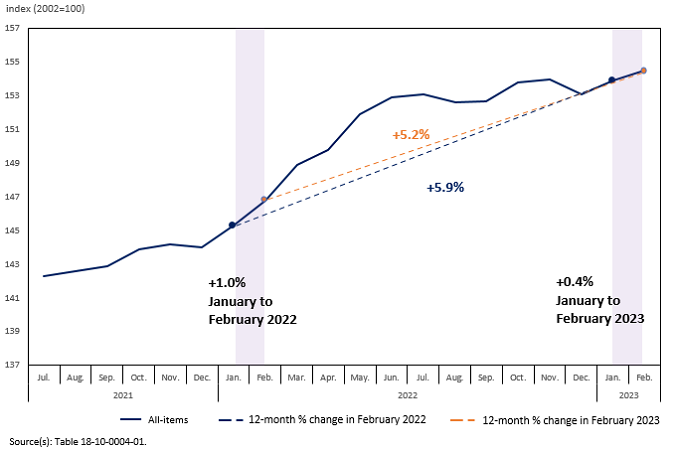
Slowdown in headline inflation reflects a base-year effect following strong price increases in February 2022

Infographic description
The title of the infographic is "Slowdown in headline inflation reflects a base-year effect following strong price increases in February 2022"
This is a line chart.
The y-axis represents the all-items index level in Canada.
The y-axis starts at 137 and goes to 157, with increments of 2.
The x-axis represents the monthly periods from July 2021 to February 2023, with increments of 1.
There is one series. The series represents the all-items index in Canada, spanning the period from July 2021 to February 2023.
There are four highlighted data points. The first two points are for January 2022 and January 2023, with index values of 145.3 and 153.9 respectively. The second two points are for February 2022 and February 2023, with index values of 146.8 and 154.5 respectively.
In July 2021, the all-items index is at 142.3.
In August 2021, the all-items index is at 142.6.
In September 2021, the all-items index is at 142.9.
In October 2021, the all-items index is at 143.9.
In November 2021, the all-items index is at 144.2.
In December 2021, the all-items index is at 144.0.
In January 2022, the all-items index is at 145.3.
In February 2022, the all-items index is at 146.8.
In March 2022, the all-items index is at 148.9.
In April 2022, the all-items index is at 149.8.
In May 2022, the all-items index is at 151.9.
In June 2022, the all-items index is at 152.9.
In July 2022, the all-items index is at 153.1.
In August 2022, the all-items index is at 152.6.
In September 2022, the all-items index is at 152.7.
In October 2022, the all-items index is at 153.8.
In November 2022, the all-items index is at 154.0.
In December 2022, the all-items index is at 153.1.
In January 2023, the all-items index is at 153.9.
In February 2023, the all-items index is at 154.5.
Source: Table 18-10-0004-01.
- Date modified: