Infographic 3
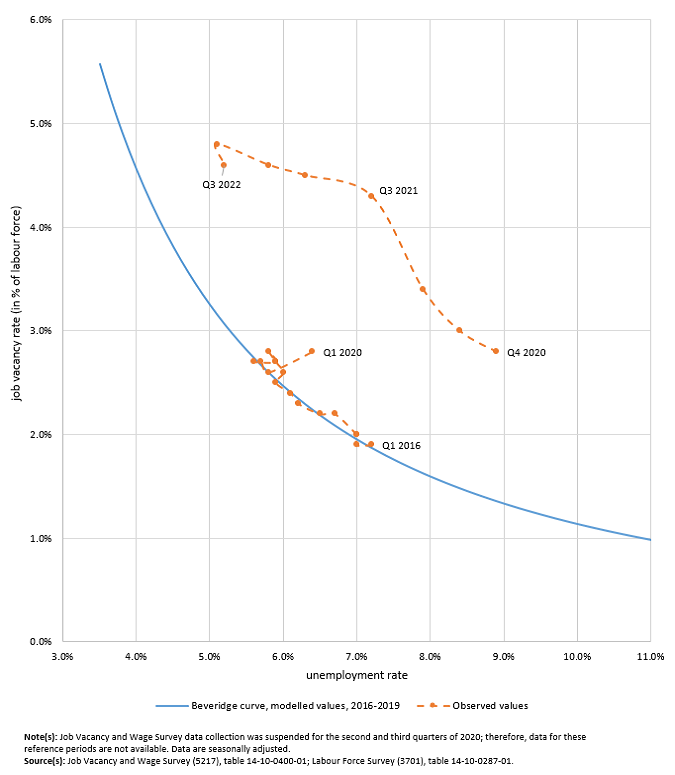
The Beveridge curve highlights recent trends in the job vacancy and unemployment rates

Infographic description
The title of the infographic is "The Beveridge curve highlights recent trends in the job vacancy and unemployment rates"
This is a non-linear chart.
The vertical axis shows the job vacancy rate (in % of labour force) from 0.0% to 6.0% by increments of 1.0 percentage point.
The horizontal axis shows the unemployment rate from 3.0% to 11.0% by increments of 1.0 percentage point.
For the job vacancy rate (in % of labour force), its lowest level was 1.9% in the first and second quarters of 2016 and its highest level was 4.8% in the second quarter of 2022.
For the unemployment rate, its lowest level was 5.1% in the second quarter of 2022 and its highest level was 8.9% in the fourth quarter of 2020.
Note(s): Job Vacancy and Wage Survey data collection was suspended for the second and third quarters of 2020; therefore, data for these reference periods are not available. Data are seasonally adjusted.
Source(s): Job Vacancy and Wage Survey (5217), table 14-10-0400-01; Labour Force Survey (3701), table 14-10-0287-01.
- Date modified: