Map 2
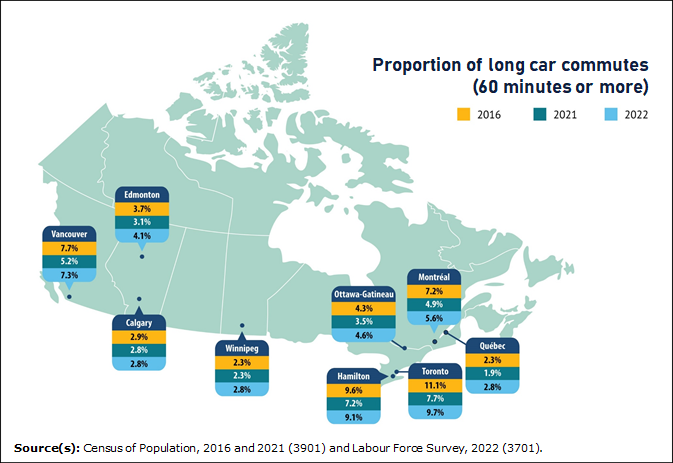
Toronto, Montréal, Vancouver and Hamilton are the only large urban centres where long commutes by car did not return to 2016 levels in May 2022

Map description
The title of the map is "Toronto, Montréal, Vancouver and Hamilton are the only large urban centres where long commutes by car did not return to 2016 levels in May 2022"
This is a map of Canada showing the proportion of long car commutes (60+ minutes) in 2016, 2021 and 2022 for selected census metropolitan areas.
In Québec, Quebec, the proportion of long car commutes (60+ minutes) was 2.3% in 2016, 1.9% in 2021 and 2.8% in 2022.
In Montréal, Quebec, the proportion of long car commutes (60+ minutes) was 7.2% in 2016, 4.9% in 2021 and 5.6% in 2022.
In Ottawa–Gatineau, in Ontario and Quebec, the proportion of long car commutes (60+ minutes) was 4.3% in 2016, 3.5% in 2021 and 4.6% in 2022.
In Toronto, Ontario, the proportion of long car commutes (60+ minutes) was 11.1% in 2016, 7.7% in 2021 and 9.7% in 2022.
In Hamilton, Ontario, the proportion of long car commutes (60+ minutes) was 9.6% in 2016, 7.2% in 2021 and 9.1% in 2022.
In Winnipeg, Manitoba, the proportion of long car commutes (60+ minutes) was 2.3% in 2016, 2.3% in 2021 and 2.8% in 2022.
In Calgary, Alberta, the proportion of long car commutes (60+ minutes) was 2.9% in 2016, 2.8% in 2021 and 2.8% in 2022.
In Edmonton, Alberta, the proportion of long car commutes (60+ minutes) was 3.7% in 2016, 3.1% in 2021 and 4.1% in 2022.
In Vancouver, British Columbia, the proportion of long car commutes (60+ minutes) was 7.7% in 2016, 5.2% in 2021 and 7.3% in 2022.
Source(s): Census of Population, 2016 and 2021 (3901) and Labour Force Survey, 2022 (3701).
- Date modified: