Map 2
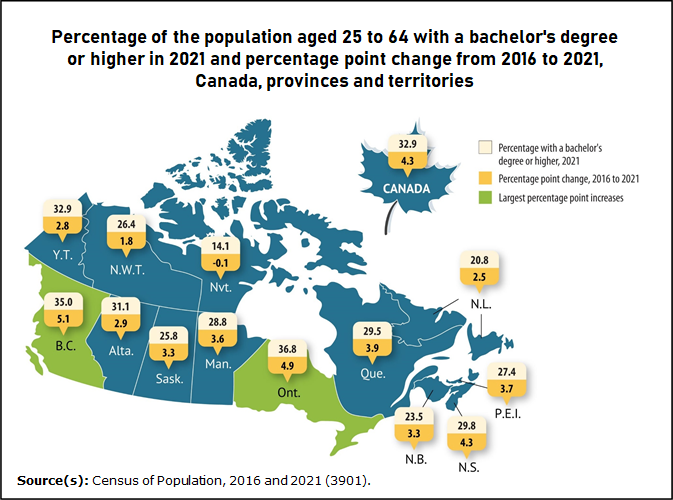
British Columbia and Ontario saw the largest percentage point increases in degree holders from 2016 to 2021

Map description
The title of the map is "British Columbia and Ontario saw the largest percentage point increases in degree holders from 2016 to 2021"
This is a map of Canada by province and territory, showing the percentage of the population aged 25 to 64 who had a bachelor's degree or higher, and the percentage point change from 2016 to 2021.
The percentage with a bachelor's degree or higher was 32.9% in Canada overall, 35.0% in British Columbia, 31.1% in Alberta, 25.8% in Saskatchewan, 28.8% in Manitoba, 36.8% in Ontario, 29.5% in Quebec, 23.5% in New Brunswick, 29.8% in Nova Scotia, 27.4% in Prince Edward Island, 20.8% in Newfoundland and Labrador, 32.9% in Yukon, 26.4% in the Northwest Territories and 14.1% in Nunavut.
The percentage point increase was highest in British Columbia, at 5.1 percentage points, and Ontario, at 4.9 percentage points, compared with the Canadian average of 4.3 percentage points.
In the other provinces and territories, the increase was 2.9 percentage points in Alberta, 3.3 percentage points in Saskatchewan, 3.6 percentage points in Manitoba, 3.9 percentage points in Quebec, 3.3 percentage points in New Brunswick, 4.3 percentage points in Nova Scotia, 3.7 percentage points in Prince Edward Island, 2.5 percentage points in Newfoundland and Labrador, 2.8 percentage points in Yukon and 1.8 percentage points in the Northwest Territories. There was a decrease of 0.1 percentage points in Nunavut.
Source(s): Census of Population, 2016 and 2021 (3901).
- Date modified: