Infographic 2
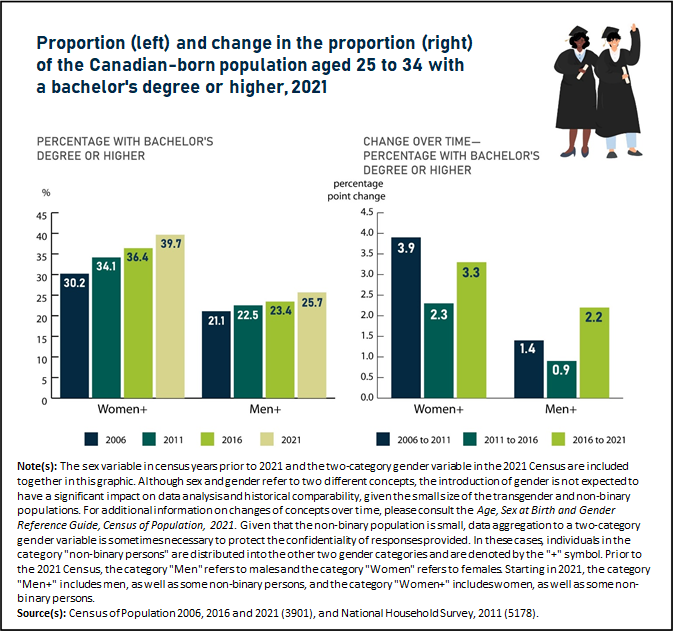
The proportion of Canadian-born men aged 25 to 34 with a bachelor's degree or higher rose more quickly from 2016 to 2021 than in the past

Infographic description
The title of the infographic is "The proportion of Canadian-born men aged 25 to 34 with a bachelor's degree or higher rose more quickly from 2016 to 2021 than in the past"
This infographic is two bar charts. The chart on the left shows the proportion of Canadian-born young adults aged 25 to 34 who had a bachelor's degree or higher, by gender, for 2006, 2011, 2016 and 2021. The chart on the right shows the percentage point change in this figure from 2006 to 2011, 2011 to 2016 and 2016 to 2021.
The axis representing the bar chart on the left shows percentages from 0% to 45%, by increments of 5%. The axis representing the bar chart on the right shows percentage point changes from 0.0 to 4.5, by increments of 0.5.
In the chart on the left, in the "Women+" category, the proportion with a bachelor's degree or higher was 30.2% in 2006, 34.1% in 2011, 36.4% in 2016 and 39.7% in 2021. In the "Men+" category, the proportion with a bachelor's degree or higher was 21.1% in 2006, 22.5% in 2011, 23.4% in 2016 and 25.7% in 2021.
In the chart on the right, in the "Women+" category, the percentage point increase in the proportion with a bachelor's degree or higher was 3.9 from 2006 to 2011, 2.3 from 2011 to 2016 and 3.3 from 2016 to 2021. In the "Men+" category, the increase was 1.4 from 2006 to 2011, 0.9 from 2011 to 2016 and 2.2 from 2016 to 2021.
Note(s): The sex variable in census years prior to 2021 and the two-category gender variable in the 2021 Census are included together in this graphic. Although sex and gender refer to two different concepts, the introduction of gender is not expected to have a significant impact on data analysis and historical comparability, given the small size of the transgender and non-binary populations. For additional information on changes of concepts over time, please consult the
Source(s): Census of Population 2006, 2016 and 2021 (3901), and National Household Survey, 2011 (5178).
- Date modified: