Map 1
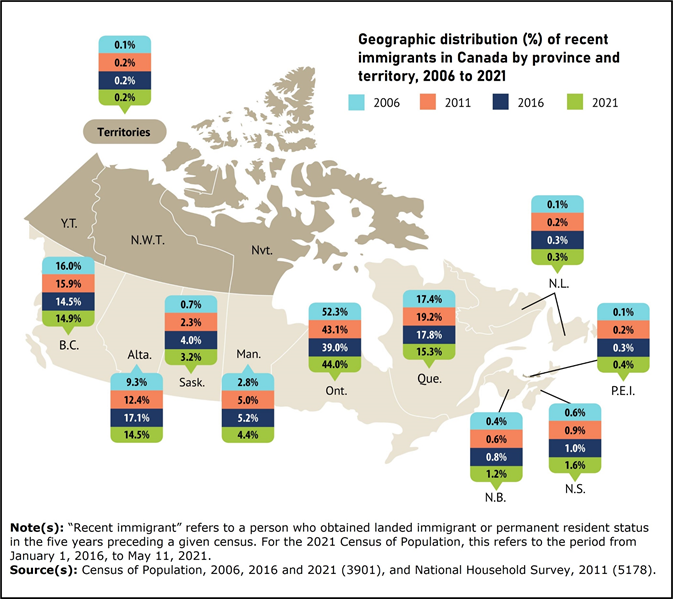
The Atlantic provinces welcomed higher shares of recent immigrants in Canada than the previous censuses, while Quebec and the Prairies saw their shares decrease

Map description
The title of the map is "The Atlantic provinces welcomed higher shares of recent immigrants in Canada than the previous censuses, while Quebec and the Prairies saw their shares decrease"
This is a map of Canada showing the share of recent immigrants by province and territory in 2006, 2011, 2016 and 2021.
In 2021, the proportion of recent immigrants in Newfoundland and Labrador was 0.3%. The proportion of recent immigrants in Newfoundland and Labrador was 0.3% in 2016; 0.2% in 2011; and 0.1% in 2006.
In 2021, the proportion of recent immigrants in Prince Edward Island was 0.4%. The proportion of recent immigrants in Prince Edward Island was 0.3% in 2016; 0.2% in 2011; and 0.1% in 2006.
In 2021, the proportion of recent immigrants in Nova Scotia was 1.6%. The proportion of recent immigrants in Nova Scotia was 1.0% in 2016; 0.9% in 2011; and 0.6% in 2006.
In 2021, the proportion of recent immigrants in New Brunswick was 1.2%. The proportion of recent immigrants in New Brunswick was 0.8% in 2016; 0.6% in 2011; and 0.4% in 2006.
In 2021, the proportion of recent immigrants in Quebec was 15.3%. The proportion of recent immigrants in Quebec was 17.8% in 2016; 19.2% in 2011; and 17.4% in 2006.
In 2021, the proportion of recent immigrants in Ontario was 44.0%. The proportion of recent immigrants in Ontario was 39.0% in 2016; 43.1% in 2011; and 52.3% in 2006.
In 2021, the proportion of recent immigrants in Manitoba was 4.4%. The proportion of recent immigrants in Manitoba was 5.2% in 2016; 5.0% in 2011; and 2.8% in 2006.
In 2021, the proportion of recent immigrants in Saskatchewan was 3.2%. The proportion of recent immigrants in Saskatchewan was 4.0% in 2016; 2.3% in 2011; and 0.7% in 2006.
In 2021, the proportion of recent immigrants in Alberta was 14.5%. The proportion of recent immigrants in Alberta was 17.1% in 2016; 12.4% in 2011; and 9.3% in 2006.
In 2021, the proportion of recent immigrants in British Columbia was 14.9%. The proportion of recent immigrants in British Columbia was 14.5% in 2016; 15.9% in 2011; and 16.0% in 2006.
In 2021, the proportion of recent immigrants in the territories (Yukon, Northwest Territories and Nunavut) was 0.2%. The proportion of recent immigrants in the territories was 0.2% in 2016; 0.2% in 2011; and 0.1% in 2006.
Note(s): "Recent immigrant" refers to a person who obtained landed immigrant or permanent resident status in the five years preceding a given census. For the 2021 Census of Population, this refers to the period from January 1, 2016, to May 11, 2021.
Source(s): Census of Population, 2006, 2016 and 2021 (3901), and National Household Survey, 2011 (5178).
- Date modified: