Infographic 2
Most common ethnic or cultural origins reported in the Atlantic provinces

Infographic description
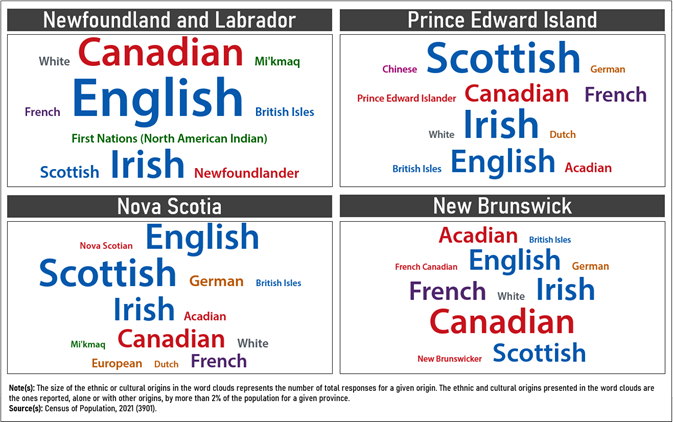
The title of the infographic is "Most common ethnic or cultural origins reported in the Atlantic provinces"
This infographic presents four word clouds that illustrate the most common ethnic or cultural origins reported in the Atlantic provinces. The size of the font is proportional to the number of total responses for a given ethnic or cultural origin.
For Newfoundland and Labrador, the biggest word is "English," representing 34.9% of all single and multiple ethnic or cultural origin responses in this province. The other ethnic or cultural origins reported most often are "Canadian," 24.9%; "Irish," 24.3%; "Newfoundlander," 6.9%; "Scottish," 6.6%; "White," 5.3%; "French," 4.6%; "Mi'kmaq," 3.8%; "British Isles," 3.6%; and "First Nations (North American Indian)," 2.2%.
For Prince Edward Island, the biggest word is "Scottish," representing 34.0% of all single and multiple ethnic or cultural origin responses in this province. The other ethnic or cultural origins reported most often are "Irish," 27.8%; "English," 24.0%; "Canadian," 15.2%; "French," 14.2%; "Acadian," 5.5%; "German," 4.8%; "White," 4.1%; "Dutch," 3.0%; "British Isles," 2.1%; "Prince Edward Islander," 2.1%; and "Chinese," 2.0%.
For Nova Scotia, the biggest word is "Scottish," representing 26.9% of all single and multiple ethnic or cultural origin responses in this province. The other ethnic or cultural origins reported most often are "English," 22.8%; "Irish," 20.5%; "Canadian," 15.8%; "French," 11.9%; "German," 9.1%; "White," 6.0%; "Acadian," 5.1%; "European," 4.7%; "British Isles," 3.4%; "Dutch," 2.9%; "Nova Scotian," 2.7%; and "Mi'kmaq," 2.2%.
For New Brunswick, the biggest word is "Canadian," representing 23.0% of all single and multiple ethnic or cultural origin responses in this province. The other ethnic or cultural origins reported most often are "Irish," 20.5%; "English," 18.1%; "Scottish," 17.7%; "French," 15.6%; "Acadian," 14.3%; "White," 5.4%; "German," 4.4%; "New Brunswicker," 2.9%; "French Canadian," 2.5%; and "British Isles," 2.2%.
Note(s): The size of the ethnic or cultural origins in the word clouds represents the number of total responses for a given origin. The ethnic and cultural origins presented in the word clouds are the ones reported, alone or with other origins, by more than 2% of the population for a given province.
Source(s): Census of Population, 2021 (3901).
- Date modified: