Infographic 6
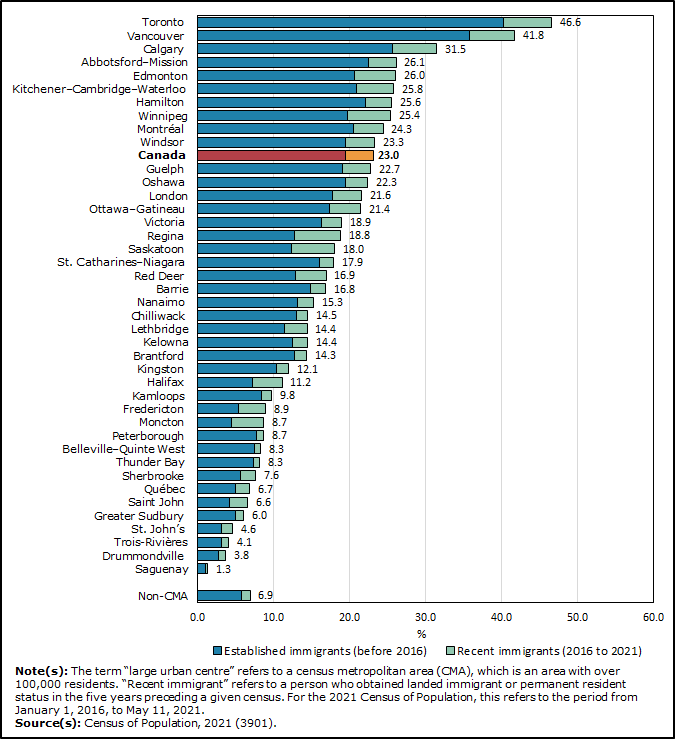
10 of Canada's 41 large urban centres have a higher proportion of immigrants than all of Canada

Infographic description
The title of the infographic is "10 of Canada's 41 large urban centres have a higher proportion of immigrants than all of Canada"
This is a stacked horizontal bar chart.
The vertical axis shows the census metropolitan areas; Canada; and outside census metropolitan areas, or "non-CMA".
The horizontal axis represents the proportion of the population who are immigrants, in percent, from 0.0% to 60.0%, by increments of 10.0%.
The first series of bars represents the proportion of established immigrants prior to 2016, with 40.2% in Toronto, 35.8% in Vancouver, 25.6% in Calgary, 22.5% in Abbotsford–Mission, 20.7% in Edmonton, 20.9% in Kitchener–Cambridge–Waterloo, 22.1% in Hamilton, 19.7% in Winnipeg, 20.5% in Montréal, 19.5% in Windsor, 19.4% in Canada, 19.0% in Guelph, 19.5% in Oshawa, 17.8% in London, 17.4% in Ottawa–Gatineau, 16.3% in Victoria, 12.7% in Regina, 12.4% in Saskatoon, 16.0% in St. Catharines–Niagara, 12.9% in Red Deer, 14.8% in Barrie, 13.2% in Nanaimo, 13.0% in Chilliwack, 11.4% in Lethbridge, 12.5% in Kelowna, 12.7% in Brantford, 10.4% in Kingston, 7.2% in Halifax, 8.4% in Kamloops, 5.4% in Fredericton, 4.5% in Moncton, 7.7% in Peterborough, 7.5% in Belleville-Quinte West, 7.3% in Thunder Bay, 5.7% in Sherbrooke, 5.0% in Québec, 4.2% in Saint John, 5.0% in Greater Sudbury, 3.1% in St. John's, 3.2% in Trois-Rivières, 2.7% in Drummondville, 1.0% in Saguenay and 5.8% outside census metropolitan areas.
The second series of bars represents the proportion of recent immigrants (2016 to 2021), with 6.4% in Toronto, 5.9% in Vancouver, 5.8% in Calgary, 3.6% in Abbotsford–Mission, 5.3% in Edmonton, 4.9% in Cambridge–Kitchener–Waterloo, 3.4% in Hamilton, 5.7% in Winnipeg, 3.9% in Montréal, 3.8% in Windsor, 3.7% in Canada, 3.7% in Guelph, 2.8% in Oshawa, 3.8% in London, 4.0% in Ottawa–Gatineau, 2.6% in Victoria, 6.1% in Regina, 5.6% in Saskatoon, 1.9% in St. Catharines–Niagara, 4.0% in Red Deer, 2.0% in Barrie, 2.1% in Nanaimo, 1.5% in Chilliwack, 3.0% in Lethbridge, 2.0% in Kelowna, 1.6% in Brantford, 1.6% in Kingston, 3.9% in Halifax, 1.3% in Kamloops, 3.5% in Fredericton, 4.2% in Moncton, 1.0% in Peterborough, 0.8% in Belleville-Quinte West, 0.9% in Thunder Bay, 1.9% in Sherbrooke, 1.8% in Québec, 2.4% in Saint John, 1.0% in Greater Sudbury, 1.5% in St. John's, 0.9% in Trois-Rivières, 1.0% in Drummondville, 0.3% in Saguenay and 1.1% outside of census metropolitan areas.
The data labels at the outside end of the horizontal bars represent the total proportion of immigrants, with 46.6% in Toronto, 41.8% in Vancouver, 31.5% in Calgary, 26.1% in Abbotsford–Mission, 26.0% in Edmonton, 25.8% in Kitchener–Cambridge–Waterloo, 25.6% in Hamilton, 25.4% in Winnipeg, 24.3% in Montréal, 23.3% in Windsor, 23.0% in Canada, 22.7% in Guelph, 22.3% in Oshawa, 21.6% in London, 21.4% in Ottawa–Gatineau, 18.9% in Victoria, 18.8% in Regina, 18.0% in Saskatoon, 17.9% in St. Catharines–Niagara, 16.9% in Red Deer, 16.8% in Barrie, 15.3% in Nanaimo, 14.5% in Chilliwack, 14.4% in Lethbridge, 14.4% in Kelowna, 14.3% in Brantford, 12.1% in Kingston, 11.2% in Halifax, 9.8% in Kamloops, 8.9% in Fredericton, 8.7% in Moncton, 8.7% in Peterborough, 8.3% in Belleville–-Quinte West, 8.3% in Thunder Bay, 7.6% in Sherbrooke, 6.7% in Québec, 6.6% in Saint John, 6.0% in Greater Sudbury, 4.6% in St. John's, 4.1% in Trois-Rivières, 3.8% in Drummondville, 1.3% in Saguenay, and 6.9% outside of census metropolitan areas.
Note(s): The term "large urban centre" refers to a census metropolitan area (CMA), which is an area with over 100,000 residents. "Recent immigrant" refers to a person who obtained landed immigrant or permanent resident status in the five years preceding a given census. For the 2021 Census of Population, this refers to the period from January 1, 2016, to May 11, 2021.
Source(s): Census of Population, 2021 (3901).
- Date modified: