Infographic 2
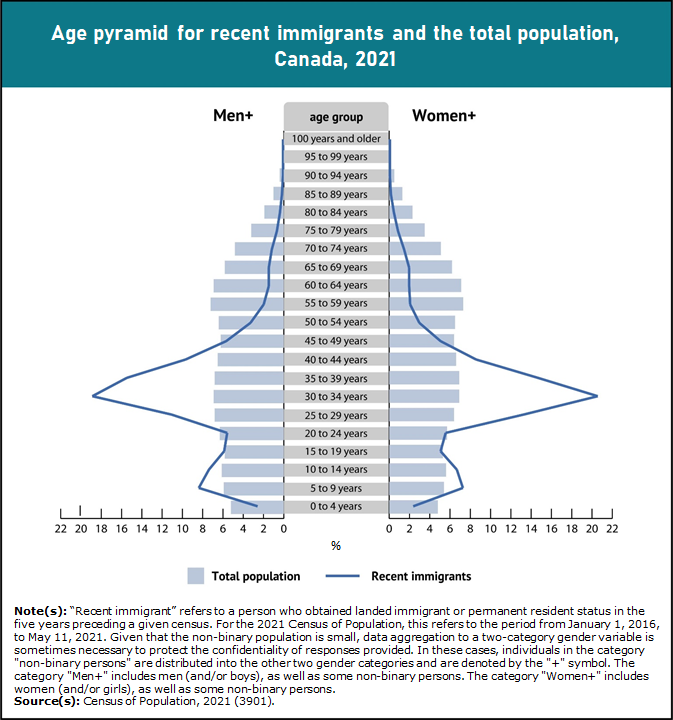
Close to two-thirds of recent immigrants are of core working age, rejuvenating Canada's aging population

Infographic description
The title of the infographic is "Close to two-thirds of recent immigrants are of core working age, rejuvenating Canada's aging population"
This infographic comprises two overlapping pyramids that represent the age and gender structure of the recent immigrant population (indicated by an outline) and the total population of Canada (indicated by solid horizontal bars) in 2021.
The line and horizontal bars on the y-axis are located in the middle of the chart and divide the pyramid in two. They indicate the five-year age groups, from 0 to 4 years to 100 years and older. People in the "Men+" category are represented on the left side of the axis, and people in the "Women+" category on the right side.
The horizontal bars on the x-axis represent the percent distribution of the recent immigrant population and the total population for each age group, from 0% to 22% in increments of 2.0. They are identical on both the right and left sides of the y-axis.
For the recent immigrant population in the "Men+" category, those aged 0 to 4 years made up 2.5% of the population; 5 to 9 years, 8.3%; 10 to 14 years, 7.3%; 15 to 19 years, 5.8%; 20 to 24 years, 5.5%; 25 to 29 years, 11.0%; 30 to 34 years, 18.8%; 35 to 39 years, 15.4%; 40 to 44 years, 9.6%; 45 to 49 years, 5.6%; 50 to 54 years, 3.2%; 55 to 59 years, 1.9%; 60 to 64 years, 1.4%; 65 to 69 years, 1.4%; 70 to 74 years, 1.1%; 75 to 79 years, 0.6%; 80 to 84 years, 0.3%; 85 to 89 years, 0.1%; 90 to 94 years, 0.0%; 95 to 99 years, 0.0%; and 100 years and older, 0.0%.
For the recent immigrant population in the "Women+" category, those aged 0 to 4 years made up 2.3% of the population; 5 to 9 years, 7.2%; 10 to 14 years, 6.6%; 15 to 19 years, 5.0%; 20 to 24 years, 5.5%; 25 to 29 years, 13.2%; 30 to 34 years, 20.5%; 35 to 39 years, 14.6%; 40 to 44 years, 8.5%; 45 to 49 years, 5.0%; 50 to 54 years, 2.9%; 55 to 59 years, 2.0%; 60 to 64 years, 1.9%; 65 to 69 years, 1.9%; 70 to 74 years, 1.4%; 75 to 79 years, 0.8%; 80 to 84 years, 0.4%; 85 to 89 years, 0.1%; 90 to 94 years, 0.0%; 95 to 99 years, 0.0%; and 100 years and older, 0.0%.
For the total population in the "Men+" category, those aged 0 to 4 years made up 5.2% of the population; 5 to 9 years, 5.9%; 10 to 14 years, 6.1%; 15 to 19 years, 5.8%; 20 to 24 years, 6.3%; 25 to 29 years, 6.8%; 30 to 34 years, 6.9%; 35 to 39 years, 6.8%; 40 to 44 years, 6.5%; 45 to 49 years, 6.2%; 50 to 54 years, 6.4%; 55 to 59 years, 7.2%; 60 to 64 years, 6.9%; 65 to 69 years, 5.8%; 70 to 74 years, 4.8%; 75 to 79 years, 3.2%; 80 to 84 years, 1.9%; 85 to 89 years, 1.0%; 90 to 94 years, 0.4%; 95 to 99 years, 0.1%; and 100 years and older, 0.0%.
For the total population in the "Women+" category, those aged 0 to 4 years made up 4.8% of the population; 5 to 9 years, 5.4%; 10 to 14 years, 5.6%; 15 to 19 years, 5.3%; 20 to 24 years, 5.7%; 25 to 29 years, 6.4%; 30 to 34 years, 6.9%; 35 to 39 years, 6.9%; 40 to 44 years, 6.6%; 45 to 49 years, 6.4%; 50 to 54 years, 6.5%; 55 to 59 years, 7.3%; 60 to 64 years, 7.1%; 65 to 69 years, 6.2%; 70 to 74 years, 5.1%; 75 to 79 years, 3.5%; 80 to 84 years, 2.3%; 85 to 89 years, 1.3%; 90 to 94 years, 0.5%; 95 to 99 years, 0.1%; and 100 years and older, 0.0%.
Note(s): "Recent immigrant" refers to a person who obtained landed immigrant or permanent resident status in the five years preceding a given census. For the 2021 Census of Population, this refers to the period from January 1, 2016, to May 11, 2021. Given that the non-binary population is small, data aggregation to a two-category gender variable is sometimes necessary to protect the confidentiality of responses provided. In these cases, individuals in the category "non-binary persons" are distributed into the other two gender categories and are denoted by the "+" symbol. The category "Men+" includes men (and/or boys), as well as some non-binary persons. The category "Women+" includes women (and/or girls), as well as some non-binary persons.
Source(s): Census of Population, 2021 (3901).
- Date modified: