Infographic 1
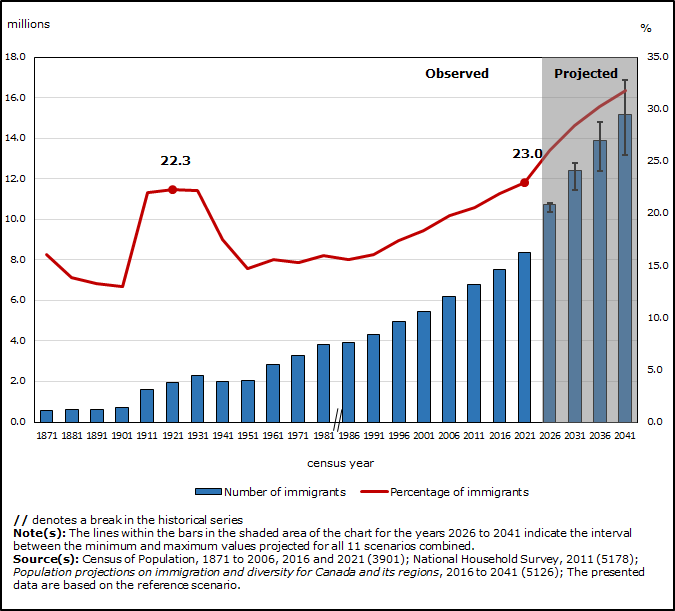
Nearly one in four people in Canada are immigrants, the highest proportion of the population in more than 150 years

Infographic description
The title of the infographic is "Nearly one in four people in Canada are immigrants, the highest proportion of the population in more than 150 years"
This is a combination bar and line chart showing the overall counts and proportion of the population of Canada who are immigrants, for each census since 1871.
The left vertical axis shows the count of immigrants per period, in millions, from 0.0 million to 18.0 million, by increments of 2.0 million.
The right vertical axis shows the proportion of the population of Canada that immigrants represent, in percent, from 0.0% to 35.0%, by increments of 5.
The horizontal axis shows the following census years: 1871, 1881, 1891, 1901, 1911, 1921, 1931, 1941, 1951, 1961, 1971, 1981, 1986, 1991, 1996, 2001, 2006, 2011, 2016, 2021, 2026, 2031, 2036, and 2041.
Each bar represents the count of immigrants on that census, with 594,207 in 1871; 602,984 in 1881; 643,871 in 1891; 699,500 in 1901; 1,586,961 in 1911; 1,955,736 in 1921; 2,307,525 in 1931; 2,018,847 in 1941; 2,059,911 in 1951; 2,844,263 in 1961; 3,295,530 in 1971; 3,843,335 in 1981; 3,908,150 in 1986; 4,342,890 in 1991; 4,971,070 in 1996; 5,448,480 in 2001; 6,186,950 in 2006; 6,775,770 in 2011; 7,540,830 in 2016; 8,361,505 in 2021; 10,712,000 in 2026; 12,408,000 in 2031; 13,891,000 in 2036; and 15,155,000 in 2041.
There is a shaded area within the chart representing the years when the proportion of the population that are immigrants is based on projected data (2026 to 2041).
The chart includes a horizontal line that shows the proportion of the population of Canada that immigrants represent, with 16.1% in 1871; 13.9% in 1881; 13.3% in 1891; 13.0% in 1901; 22.0% in 1911; 22.3% in 1921; 22.2% in 1931; 17.5% in 1941; 14.7% in 1951; 15.6% in 1961; 15.3% in 1971; 16.0% in 1981; 15.6% in 1986; 16.1% in 1991; 17.4% in 1996; 18.4% in 2001; 19.8% in 2006; 20.6% in 2011; 21.9% in 2016; 23.0% in 2021; 26.0% in 2026; 28.4% in 2031; 30.3% in 2036; and 31.8% in 2041.
// denotes a break in the historical series
Note(s): The lines within the bars in the shaded area of the chart for the years 2026 to 2041 indicate the interval between the minimum and maximum values projected for all 11 scenarios combined.
Source(s): Census of Population, 1871 to 2006, 2016 and 2021 (3901); National Household Survey, 2011 (5178);
- Date modified: