Infographic 1
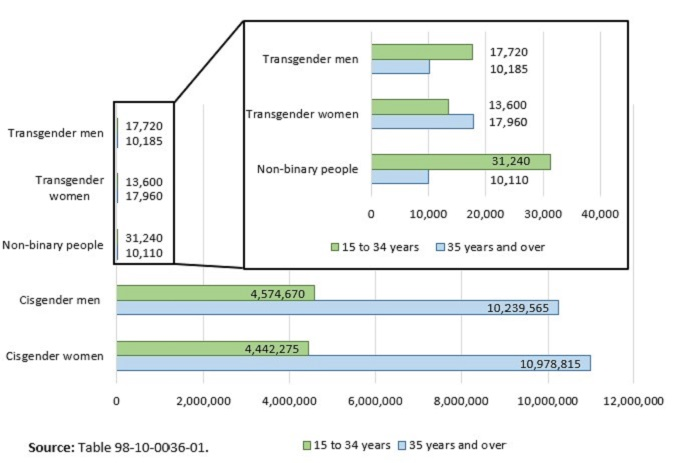
Cisgender, transgender and non-binary people, aged 15 to 34 years and 35 years and older in Canada, 2021

Infographic description
The title of the infographic is "Cisgender, transgender and non-binary people, aged 15 to 34 years and 35 years and older in Canada, 2021"
This infographic presents two horizontal bar charts.
The horizontal axis for the larger horizontal bar chart shows the number of people in Canada from 0 to 12,000,000 by increments of 2,000,000 people. The vertical axis for the larger horizontal bar chart shows groups of people by gender and age.
The horizontal axis for the smaller horizontal bar chart shows the number of people in Canada from 0 to 40,000 by increments of 10,000 people. The vertical axis for the smaller horizontal bar chart shows groups of people by gender and age.
There are two series of bars for each gender. The green bar represents people aged 15 to 34 years in 2021, and the blue bar represents people aged 35 years and older in 2021.
The larger horizontal bar chart has five sets of bars. The first three sets of bars have a black box around them. The black box represents the smaller horizontal bar chart.
The first set of bars represents the number of transgender men aged 15 to 34 years in 2021, at 17,720, and 35 years and older in 2021, at 10,185. These bars are not visible on the larger horizontal bar chart scale.
The second set of bars represents the number of transgender women aged 15 to 34 years in 2021, at 13,600, and 35 years and older in 2021, at 17,960. These bars are not visible on the larger horizontal bar chart scale.
The third set of bars represents the number of non-binary people aged 15 to 34 years in 2021, at 31,240, and 35 years and older in 2021, at 10,110. These bars are not visible on the larger horizontal bar chart scale.
The fourth set of bars represents the number of cisgender men aged 15 to 34 years in 2021, at 4,574,670, and 35 years and older in 2021, at 10,239,565. These bars are clearly visible on the larger horizontal bar chart scale.
The fifth set of bars represents the number of cisgender women aged 15 to 34 years in 2021, at 4,442,275, and 35 years and older in 2021, at 10,978,815. These bars are clearly visible on the larger horizontal bar chart scale.
The smaller horizontal bar chart has three sets of bars.
The first set of bars represents the number of transgender men aged 15 to 34 years in 2021, at 17,720, and 35 years and older in 2021, at 10,185. These bars are now clearly visible on the smaller horizontal bar chart scale.
The second set of bars represents the number of transgender women aged 15 to 34 years in 2021, at 13,600, and 35 years and older in 2021, at 17,960. These bars are now clearly visible on the smaller horizontal bar chart scale.
The third set of bars represents the number of non-binary people aged 15 to 34 years in 2021, at 31,240, and 35 years and older in 2021, at 10,110. These bars are now clearly visible on the smaller horizontal bar chart scale.
Source: Table 98-10-0036-01.
- Date modified: