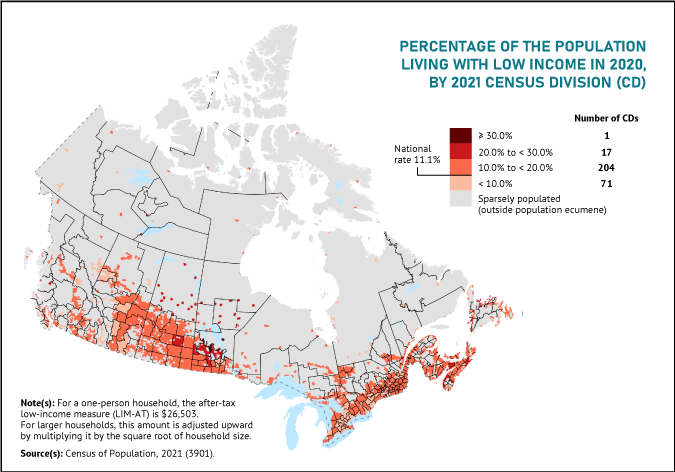
Map 4
Alberta remained the province with the lowest low-income rate in 2020

Map description
The title of the map is "Alberta remained the province with the lowest low-income rate in 2020"
This is a map of Canada, showing the percentage of the population below the after-tax low-income measure in 2020, by 2021 census division (CD).
The map shows census divisions where the percentage was greater than 30.0%, where the percentage was less than 30.0% but greater or equal to 20.0%, where the percentage was less than 20.0% but greater or equal to 10.0%, and where it was lower than 10.0%.
The map shows that there was one census division where the percentage of the population below the after-tax low-income measure was greater than 30.0%.
The map shows that there were 17 census divisions where the percentage was less than 30.0% but greater or equal to 20.0%.
The map shows that there were 204 census divisions where the percentage was less than 20.0% but greater or equal to 10.0%.
The map shows that there were 71 census divisions where the percentage was lower than 10.0%.
Note(s): For a one-person household, the after-tax low income measure (LIM-AT) is $26,503. For larger households, this amount is adjusted upward by multiplying it by the square root of household size.
Source(s): Census of Population, 2021 (3901).
- Date modified: