Map 3
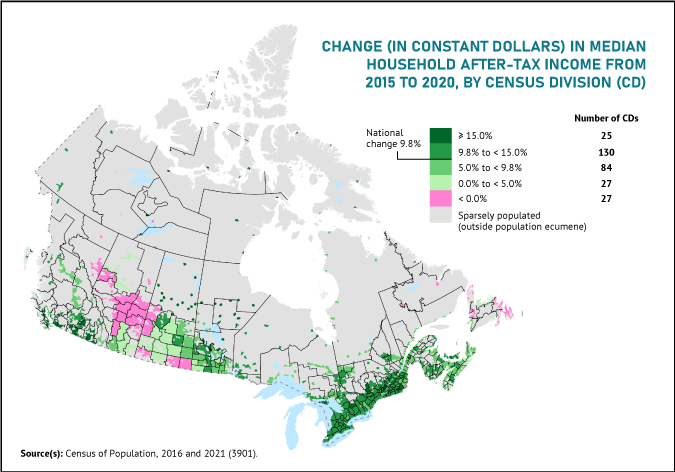
Areas recording declines of their median after-tax income from 2015 to 2020 were concentrated in Alberta, Saskatchewan and Newfoundland and Labrador

Map description
The title of the map is "Areas recording declines of their median after-tax income from 2015 to 2020 were concentrated in Alberta, Saskatchewan and Newfoundland and Labrador"
This is a map of Canada, showing the changes in constant dollars in the median household after-tax income from 2015 to 2020, by 2021 census division (CD).
The map shows census divisions where the change was greater than 15%, where the change was lower than 15% but greater or equal to 9.8%, where the change was lower than 9.8% but greater or equal to 5%, where the change was lower than 5% but greater or equal to 0%, and where the change was less than 0%.
The map shows that there were 25 census divisions recording a change in the median household after-tax income from 2015 to 2020 greater than 15%.
The map shows that there were 130 census divisions recording a change in the median household after-tax income from 2015 to 2020 lower than 15% but greater or equal to 9.8%.
The map shows that there were 84 census divisions recording a change in the median household after-tax income from 2015 to 2020 lower than 9.8% but greater or equal to 5%.
The map shows that there were 27 census divisions recording a change in the median household after-tax income from 2015 to 2020 lower than 5% but greater or equal to 0%.
The map shows that there were 27 census divisions recording a change in the median household after-tax income from 2015 to 2020 lower than 0%.
Source(s): Census of Population, 2016 and 2021 (3901).
- Date modified: