Infographic 9
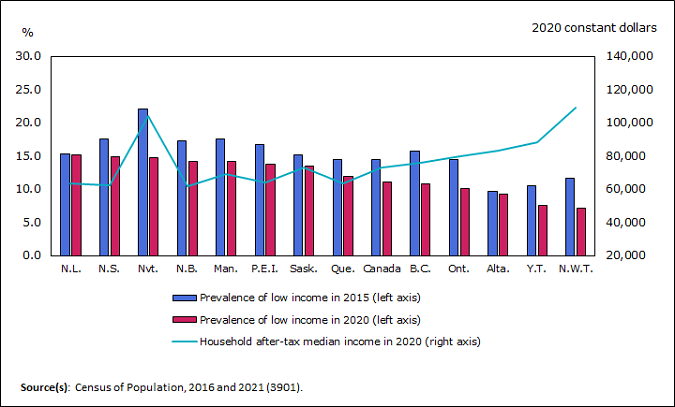
The low-income rate decreased in all provinces and territories

Infographic description
The title of the infographic is "The low-income rate decreased in all provinces and territories"
This is a combination bar chart and line chart.
The right vertical axis shows the low-income rate (%) from 0.0% to 30.0%, by increments of 5%.
The left vertical axis shows the household after-tax median income ($) from $20,000 to $140,000, by increments of $20,000.
The horizontal axis shows the Canadian provinces and territories including national average.
The first bar represents the low-income rate in 2015, with Canada at 14.4%, Newfoundland and Labrador at 15.3%, Nova Scotia at 17.5%, Nunavut at 22.1%, New Brunswick at 17.3%, Manitoba at 17.5%, Prince Edward Island at 16.7%, Saskatchewan at 15.1%, Quebec at 14.5%, British Columbia at 15.7%, Ontario at 14.4%, Alberta at 9.7%, Yukon at 10.5%, and Northwest Territories at 11.7%.
The second bar represents the low-income rate in 2020, with Canada at 11.1%, Newfoundland and Labrador at 15.2%, Nova Scotia at 14.9%, Nunavut at 14.7%, New Brunswick at 14.2%, Manitoba at 14.2%, Prince Edward Island at 13.8%, Saskatchewan at 13.4%, Quebec at 11.9%, British Columbia at 10.8%, Ontario at 10.1%, Alberta at 9.2%, Yukon at 7.6%, and Northwest Territories at 7.2%.
The line represents the household after-tax median income in 2020 in dollars, with Canada at $73,000, Newfoundland and Labrador at $63,200, Nova Scotia at $62,400, Nunavut at $104,000, New Brunswick at $62,000, Manitoba at $69,000, Prince Edward Island at $64,000, Saskatchewan at $73,000, Quebec at $63,200, British Columbia at $76,000, Ontario at $79,500, Alberta at $83,000, Yukon at $88,000, and Northwest Territories at $109,000.
Source(s): Census of Population, 2016 and 2021 (3901).
- Date modified: