Infographic 7
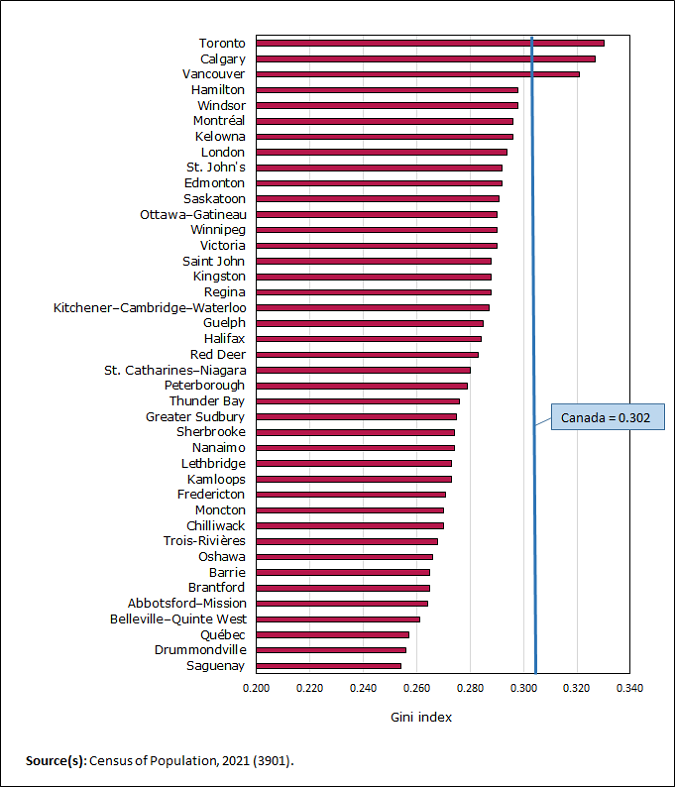
Income inequality highest in Toronto, Calgary and Vancouver

Infographic description
The title of the infographic is "Income inequality highest in Toronto, Calgary and Vancouver"
This is a horizontal bar chart.
The vertical axis lists census metropolitan areas: Toronto, Calgary, Vancouver, Hamilton, Windsor, Montréal, Kelowna, London, St. John's, Edmonton, Saskatoon, Ottawa–Gatineau, Winnipeg, Victoria, Saint John, Kingston, Regina, Kitchener–Cambridge–Waterloo, Guelph, Halifax, Red Deer, St. Catharines–Niagara, Peterborough, Thunder Bay, Greater Sudbury, Sherbrooke, Nanaimo, Lethbridge, Kamloops, Fredericton, Moncton, Chilliwack, Trois-Rivières, Oshawa, Barrie, Brantford, Abbotsford–Mission, Belleville–Quinte West, Québec, Drummondville, and Saguenay.
The horizontal axis shows the Gini index from 0.200 to 0.340, by increments of 0.020.
There is a vertical line at 0.302 showing the national Gini index for Canada.
The bars descend with Toronto at 0.330, Calgary at 0.327, Vancouver at 0.321, Hamilton at 0.298, Windsor at 0.298, Montréal at 0.296, Kelowna at 0.296, London at 0.294, St. John's at 0.292, Edmonton at 0.292, Saskatoon at 0.291, Ottawa–Gatineau at 0.290, Winnipeg at 0.290, Victoria at 0.290, Saint John at 0.288, Kingston at 0.288, Regina at 0.288, Kitchener–Cambridge–Waterloo at 0.287, Guelph at 0.285, Halifax at 0.284, Red Deer at 0.283, St. Catharines–Niagara at 0.280, Peterborough at 0.279, Thunder Bay at 0.276, Greater Sudbury at 0.275, Sherbrooke at 0.274, Nanaimo at 0.274, Lethbridge at 0.273, Kamloops at 0.273, Fredericton at 0.271, Moncton at 0.270, Chilliwack at 0.270, Trois-Rivières at 0.268, Oshawa at 0.266, Barrie at 0.265, Brantford at 0.265, Abbotsford–Mission at 0.264, Belleville–Quinte West at 0.261, Québec at 0.257, Drummondville at 0.256, and Saguenay at 0.254.
Source(s): Census of Population, 2021 (3901).
- Date modified: