Infographic 6
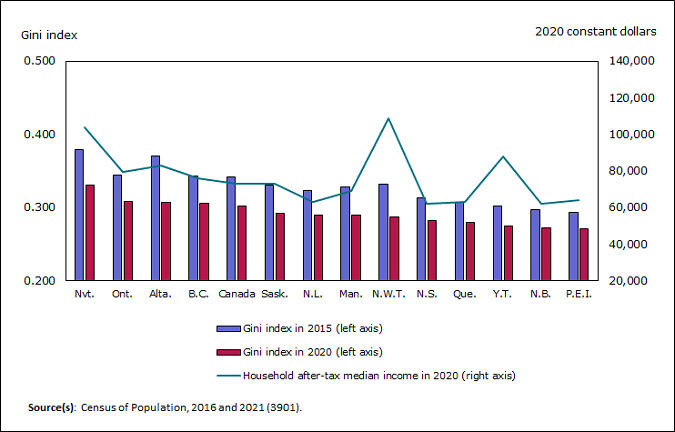
Income inequality falls in all provinces and territories, remains highest in Nunavut

Infographic description
The title of the infographic is "Income inequality falls in all provinces and territories, remains highest in Nunavut"
This is a combination bar chart and line graph.
The vertical axis to the left shows the Gini index from 0.200 to 0.500, by increments 0.1.
The vertical axis to the right shows 2020 constant dollars from $20,000 to $140,000, by increments of $20,000.
The horizontal axis shows all the provinces and territories in Canada, including a bar showing Canada's average.
The first set of bars represents the Gini index in 2015, with Nunavut at 0.379, Ontario at 0.344, Alberta at 0.371, British Columbia at 0.343, Canada at 0.342, Saskatchewan at 0.331, Newfoundland and Labrador at 0.323, Manitoba at 0.328, Northwest Territories at 0.332, Nova Scotia at 0.314, Quebec at 0.307, Yukon at 0.302, New Brunswick at 0.298, and Prince Edward Island at 0.294.
The second set of bars represents the Gini index in 2020, with Nunavut at 0.331, Ontario at 0.308, Alberta at 0.307, British Columbia at 0.306, Canada at 0.302, Saskatchewan at 0.293, Newfoundland and Labrador at 0.290, Manitoba at 0.290, Northwest Territories at 0.287, Nova Scotia at 0.282, Quebec at 0.280, Yukon at 0.275, New Brunswick at 0.272, and Prince Edward Island at 0.271.
The line represents household after-tax median income in 2020 ($). The points show Nunavut with $104,000, Ontario with $79,500, Alberta with $83,000, British Columbia with $76,000, Canada with $73,000, Saskatchewan with $73,000, Newfoundland and Labrador with $63,200, Manitoba with $69,000, Northwest Territories with $109,000, Nova Scotia with $62,400, Quebec with $63,200, Yukon with $88,000, New Brunswick with $62,000, and Prince Edward Island with $64,000.
Source(s): Census of Population, 2016 and 2021 (3901).
- Date modified: