Infographic 1
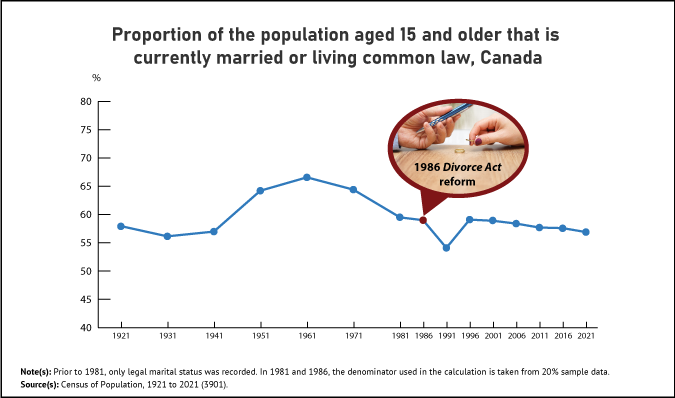
Throughout the last century, most adults were married or living common law

Infographic description
The title of the infographic is "Throughout the last century, most adults were married or living common law"
This is a line chart with markers.
The vertical axis shows the proportion of the population aged 15 years and older that is currently married or living common law in Canada. It begins at 40% and ends at 80%, by increments of 5%.
The horizontal axis shows the years 1921 to 2021. From 1921 to 1981, the years are presented in increments of 10 years. From 1981 to 2021, the years are presented in increments of 5 years.
Next to the year 1986, a bubble is displayed, which reads "1986
The proportion of the population aged 15 years and older that is currently married or living common law was: 57.9% in 1921, 56.1% in 1931, 57.0% in 1941, 64.2% in 1951, 66.6% in 1961, 64.4% in 1971, 59.5% in 1981, 59.0% in 1986, 54.1% in 1991, 59.1% in 1996, 58.9% in 2001, 58.4% in 2006, 57.7% in 2011, 57.6% in 2016, and 56.9% in 2021.
Note(s): Prior to 1981, only legal marital status was recorded. In 1981 and 1986, the denominator used in the calculation is taken from 20% sample data.
Source(s): Census of Population, 1921 to 2021 (3901).
- Date modified: