Infographic 1
One-person households remain predominant in 2021

Infographic description
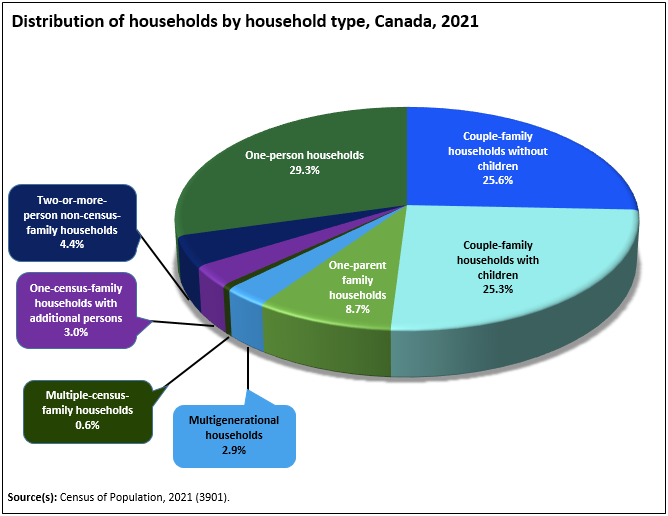
The title of the infographic is "One-person households remain predominant in 2021"
The infographic displays a pie chart with 8 sections representing different types of households: one-person households (in dark green); couple-family households without children (in medium blue); couple-family households with children (in turquoise); one-parent-family households (in light green); multigenerational households (in light blue); multiple-census-family households (in very dark green); one-census-family households with additional persons (in purple); and two-or-more-person non-census-family households (in dark blue).
In 2021, 29.3% of households in Canada were one-person households, 25.6% were couple-family-households without children; 25.3% were couple-family-households with children; 8.7% were one-parent-family households; 2.9% were multigenerational households; 0.6% multiple-census-family households; 3.0% were one-census-family-households with additional persons; and 4.4% were two-or-more-person non-census-family households.
Source(s): Census of Population, 2021 (3901).
- Date modified: