Infographic 1
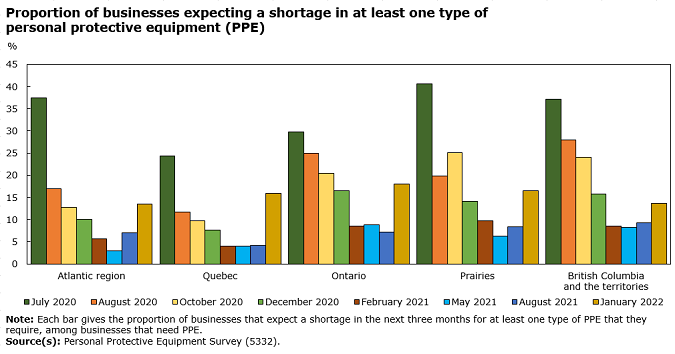
Proportion of businesses expecting a shortage in at least one personal protective equipment

Infographic description
The title of the infographic is "Proportion of businesses expecting a shortage in at least one personal protective equipment"
This is a bar chart.
The y-axis represents the percent of businesses expecting a shortage.
The y-axis starts at 0 and goes to 45, with increments of 5.
The x-axis represents the different regions among different periods.
There are eight series. The series represent July 2020, August 2020, October 2020, December 2020, February 2021, May 2021, August 2021, and January 2022.
In the Atlantic region, at period July 2020 the proportion is 37.5%.
In the Atlantic region, at period August 2020 the proportion is 17.0%.
In the Atlantic region, at period October 2020 the proportion is 12.7%.
In the Atlantic region, at period December 2020 the proportion is 10.1%.
In the Atlantic region, at period February 2021 the proportion is 5.6%.
In the Atlantic region, at period May 2021 the proportion is 2.9%.
In the Atlantic region, at period August 2021 the proportion is 7.0%.
In the Atlantic region, at period January 2022 the proportion is 13.5%.
In Quebec, at period July 2020 the proportion is 24.3%.
In Quebec, at period August 2020 the proportion is 11.7%.
In Quebec, at period October 2020 the proportion is 9.7%.
In Quebec, at period December 2020 the proportion is 7.6%.
In Quebec, at period February 2021 the proportion is 4.0%.
In Quebec, at period May 2021 the proportion is 4.0%.
In Quebec, at period August 2021 the proportion is 7.0%.
In Quebec, at period January 2022 the proportion is 15.9%.
In Ontario, at period July 2020 the proportion is 29.7%.
In Ontario, at period August 2020 the proportion is 24.9%.
In Ontario, at period October 2020 the proportion is 20.5%.
In Ontario, at period December 2020 the proportion is 16.5%.
In Ontario, at period February 2021 the proportion is 8.6%.
In Ontario, at period May 2021 the proportion is 8.8%.
In Ontario, at period August 2021 the proportion is 7.2%.
In Ontario, at period January 2022 the proportion is 18.0%.
In the Prairies, at period July 2020 the proportion is 40.6%.
In the Prairies, at period August 2020 the proportion is 19.9%.
In the Prairies, at period October 2020 the proportion is 25.1%.
In the Prairies, at period December 2020 the proportion is 14.1%.
In the Prairies, at period February 2021 the proportion is 9.8%.
In the Prairies, at period May 2021 the proportion is 6.3%.
In the Prairies, at period August 2021 the proportion is 8.4%.
In the Prairies, at period January 2022 the proportion is 16.5%.
In British Columbia and the territories, at period July 2020 the proportion is 37.2%.
In British Columbia and the territories, at period August 2020 the proportion is 28.0%.
In British Columbia and the territories, at period October 2020 the proportion is 24.0%.
In British Columbia and the territories, at period December 2020 the proportion is 15.7%.
In British Columbia and the territories, at period February 2021 the proportion is 8.5%.
In British Columbia and the territories, at period May 2021 the proportion is 8.3%.
In British Columbia and the territories, at period August 2021 the proportion is 9.3%.
In British Columbia and the territories, at period January 2022 the proportion is 13.6%.
Source(s): Personal Protective Equipment Survey (5332).
- Date modified: