
Infographic 2
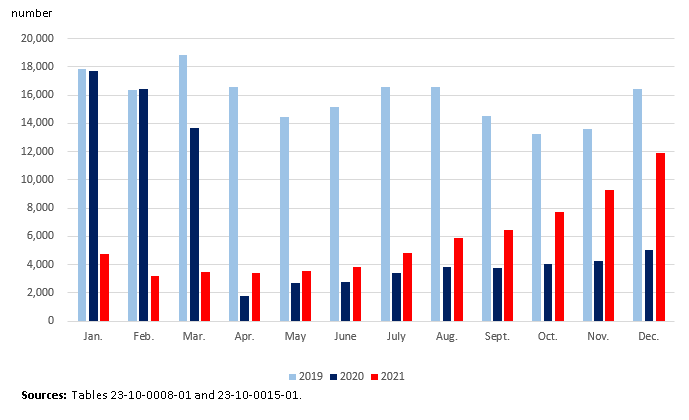
Other international movements at major airports, 2019 to 2021
Infographic description
The title of the infographic is "Other international movements at major airports, 2019 to 2021"
This is a vertical bar chart.
The vertical axis represents the total number of aircraft movements.
The vertical axis starts at 0 and goes to 20,000, with increments of 2,000.
The horizontal axis represents the months of the year and goes from January to December.
There are three series. The first series represents the year 2019. The second series represents the year 2020. The third series represents the year 2021.
In January, the first series is at 17,860, the second series is at 17,736, and the third series is at 4,750.
In February, the first series is at 16,384, the second series is at 16,474, and the third series is at 3,193.
In March, the first series is at 18,851, the second series is at 13,666, and the third series is at 3,477.
In April, the first series is at 16,564, the second series is at 1,790, and the third series is at 3,398.
In May, the first series is at 14,433, the second series is at 2,685, and the third series is at 3,537.
In June, the first series is at 15,175, the second series is at 2,778, and the third series is at 3,863.
In July, the first series is at 16,557, the second series is at 3,421, and the third series is at 4,810.
In August, the first series is at 16,573, the second series is at 3,856, and the third series is at 5,896.
In September, the first series is at 14,532, the second series is at 3,749, and the third series is at 6,430.
In October, the first series is at 13,249, the second series is at 4,052, and the third series is at 7,750.
In November, the first series is at 13,607, the second series is at 4,239, and the third series is at 9,294.
In December, the first series is at 16,475, the second series is at 5,003, and the third series is at 11,908.
Sources: Tables 23-10-0008-01 and 23-10-0015-01.
- Date modified: