Infographic 1
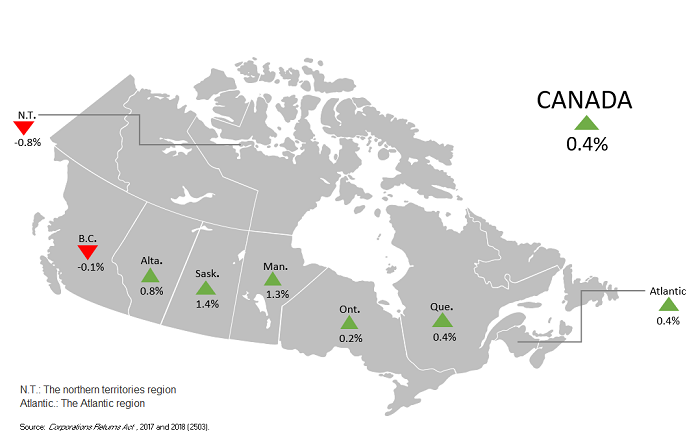
The change in the proportion of women directors by province and territory from 2017 to 2018

Infographic description
The title of the infographic is "The change in the proportion of women directors by province and territory from 2017 to 2018"
The title of the infographic is The change in the proportion of women directors by province and territory from 2017 to 2018.
This is a map of Canada showing the year-over-year change in the proportion of women directors from 2017 to 2018, by province and territory. Green arrows represent an increase, while red arrows represent a decrease.
To protect the privacy and confidentiality of individuals, the provinces in the Atlantic region (Newfoundland and Labrador, Prince Edward Island, New Brunswick, and Nova Scotia) and the territories in the northern territories region (the Northwest Territories, Yukon and Nunavut) were combined.
The proportion of women directors by province and territory was up 0.4% in Canada from 2017 to 2018, up 0.4% in the Atlantic region, up 0.4% in Quebec, up 0.2% in Ontario, up 1.3% in Manitoba, up 1.4% in Saskatchewan, up 0.8% in Alberta, down 0.1% in British Columbia, and down 0.8% in the northern territories region.
- Date modified: