Infographic 6
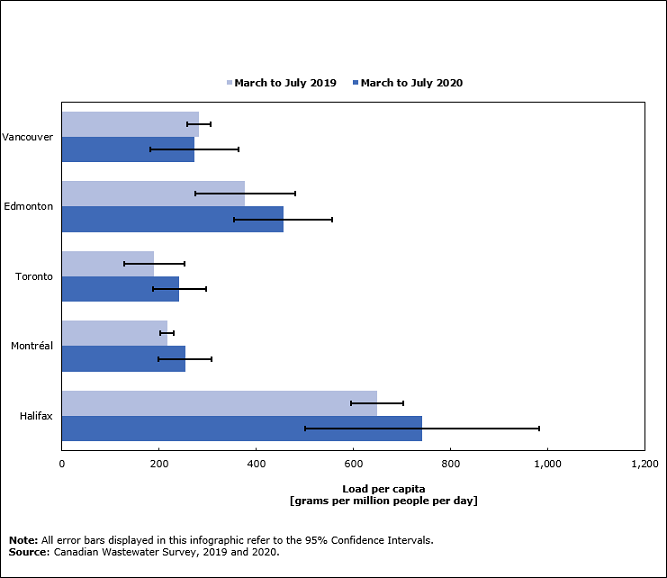
Cannabis metabolite load per capita, by city, March to July 2019 and March to July 2020

Infographic description
The title of the infographic is "Cannabis metabolite load per capita, by city, March to July 2019 and March to July 2020"
This infographic is a horizontal bar chart with error intervals representing the 95% confidence intervals.
The Y axis represents the cities Halifax, Montréal, Toronto, Edmonton, and Vancouver. Each horizontal bar of the Y axis corresponds to a municipality; the bottom one corresponds to Halifax and the top one to Vancouver.
The X axis represents load per capita [grams per million people per day]. The X axis starts at 0 and goes to 1,200, with increments of 200.
The unit of measure is grams per million people per day.
There are two series.
The first series, March – July 2019, represents the load per capita [grams per million people per day] in 2019.
Halifax has 650 grams per 1,000,000 people per day, with an error interval of plus or minus 54 grams per 1,000,000 people per day in March – July 2019.
Montréal has 216 grams per 1,000,000 people per day, with an error interval of plus or minus 13 grams per 1,000,000 people per day in March – July 2019.
Toronto has 190 grams per 1,000,000 people per day, with an error interval of plus or minus 62 grams per 1,000,000 people per day in March – July 2019.
Edmonton has 377 grams per 1,000,000 people per day, with an error interval of plus or minus 103 grams per 1,000,000 people per day in March – July 2019.
Vancouver has 283 grams per 1,000,000 people per day, with an error interval of plus or minus 24 grams per 1,000,000 people per day in March – July 2019.
The second series, March – July 2020, represents the load per capita [grams per million people per day] in 2020.
Halifax has 742 grams per 1,000,000 people per day, with an error interval of plus or minus 240 grams per 1,000,000 people per day in March – July 2020.
Montréal has 254 grams per 1,000,000 people per day, with an error interval of plus or minus 54 grams per 1,000,000 people per day in March – July 2020.
Toronto has 242 grams per 1,000,000 people per day, with an error interval of plus or minus 55 grams per 1,000,000 people per day in March – July 2020.
Edmonton has 455 grams per 1,000,000 people per day, with an error interval of plus or minus 100 grams per 1,000,000 people per day in March – July 2020.
Vancouver has 273 grams per 1,000,000 people per day, with an error interval of plus or minus 90 grams per 1,000,000 people per day in March – July 2020.
Note: All error bars in this infographic refer to the 95% confidence intervals.
Source: Canadian Wastewater Survey, 2019 and 2020.
- Date modified: