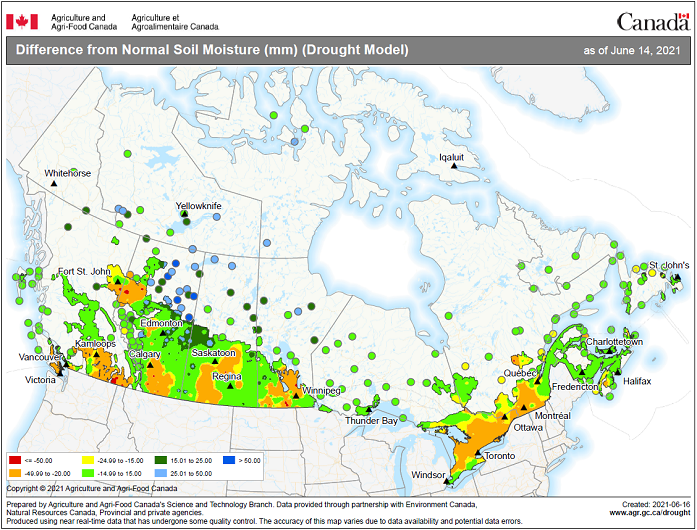
Map 1
Difference from normal soil moisture (in millimetres) (drought model) as of June 14, 2021 (during the collection period), compared with annual average, by province

Map description
The title of the map is "Difference from normal soil moisture (in millimetres) (drought model) as of June 14, 2021 (during the collection period), compared with annual average, by province"
Accessibility Information: The title of the map is "Difference from Normal Soil Moisture (in millimetres) as of June 14, 2021, based on Drought Model". This map shows below average soil moisture in parts of southern Alberta, central Saskatchewan, central Manitoba, much of Ontario, and Southern Quebec. Soil moisture conditions were normal in much of Alberta, eastern and western Saskatchewan, southern Ontario and Atlantic Canada.
Source: Agriculture and Agri-Food Canada, Drought Watch Map Archive.
- Date modified: