Infographic 1
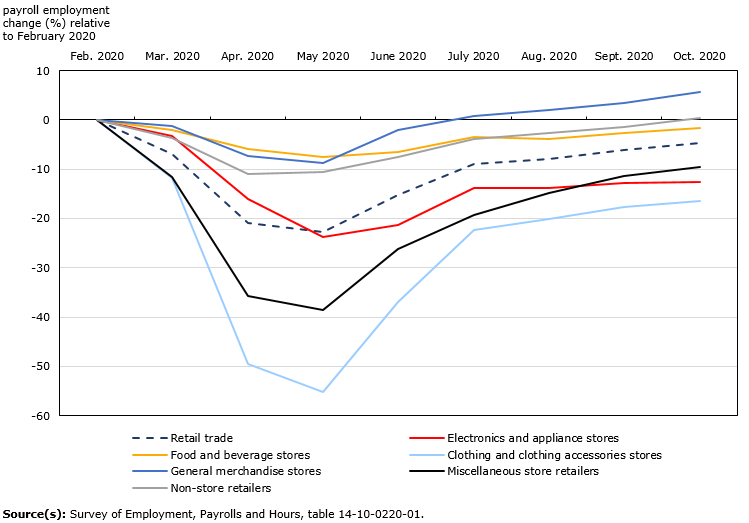
Payroll employment in clothing and clothing accessories stores furthest from February levels within the retail trade sector

Infographic description
The title of the infographic is "Payroll employment in clothing and clothing accessories stores furthest from February levels within the retail trade sector"
This is a linear chart.
The vertical axis shows payroll employment change (%) relative to February 2020 from -60 to 10 by increments of 10.
The horizontal axis shows months from February 2020 to October 2020.
There are 7 lines each representing the following series: Retail trade; Electronics and appliance stores; Food and beverage stores; Clothing and clothing accessories stores; General merchandise stores; Miscellaneous store retailers; and Non-store retailers.
The dark blue dashed line representing "Retail trade" shows the payroll employment change (%) relative to February 2020 over 9 months. The payroll employment change is 0.0% in February 2020, -7.0% in March 2020, -20.9% in April 2020, -22.7% in May 2020, -15.3% in June 2020, -9.0% in July 2020, -7.9% in August 2020, -6.1% in September 2020 and -4.7% in October 2020.
The red line representing "Electronics and appliance stores" shows the payroll employment change (%) relative to February 2020 over 9 months. The payroll employment change is 0.0% in February 2020, -3.2% in March 2020, -16.0% in April 2020, -23.7% in May 2020, -21.3% in June 2020, -13.8% in July 2020, -13.8% in August 2020, -12.8% in September 2020 and -12.5% in October 2020.
The yellow line representing "Food and beverage stores" shows the payroll employment change (%) relative to February 2020 over 9 months. The payroll employment change is 0.0% in February 2020, -2.1% in March 2020, -5.9% in April 2020, -7.6% in May 2020, -6.5% in June 2020, -3.4% in July 2020, -3.9% in August 2020, -2.7% in September 2020 and -1.7% in October 2020.
The light blue line representing "Clothing and clothing accessories stores" shows the payroll employment change (%) relative to February 2020 over 9 months. The payroll employment change is 0.0% in February 2020, -11.8% in March 2020, -49.6% in April 2020, -55.1% in May 2020, -37.0% in June 2020, -22.3% in July 2020, -20.0% in August 2020, -17.6% in September 2020 and -16.4% in October 2020.
The medium blue line representing "General merchandise stores" shows the payroll employment change (%) relative to February 2020 over 9 months. The payroll employment change is 0.0% in February 2020, -1.2% in March 2020, -7.4% in April 2020, -8.8% in May 2020, -2.0% in June 2020, 0.9% in July 2020, 2.1% in August 2020, 3.4% in September 2020 and 5.6% in October 2020.
The black line representing "Miscellaneous store retailers" shows the payroll employment change (%) relative to February 2020 over 9 months. The payroll employment change is 0.0% in February 2020, -11.6% in March 2020, -35.7% in April 2020, -38.6% in May 2020, -26.2% in June 2020, -19.2% in July 2020, -14.8% in August 2020, -11.4% in September 2020 and -9.5% in October 2020.
The grey line representing "Non-store retailers" shows the payroll employment change (%) relative to February 2020 over 9 months. The payroll employment change is 0.0% in February 2020, -3.6% in March 2020, -10.9% in April 2020, -10.6% in May 2020, -7.5% in June 2020, -3.9% in July 2020, -2.7% in August 2020, -1.4% in September 2020 and 0.3% in October 2020.
Source(s): Survey of Employment, Payrolls and Hours, table 14-10-0220-01.
- Date modified: