
Infographic 2
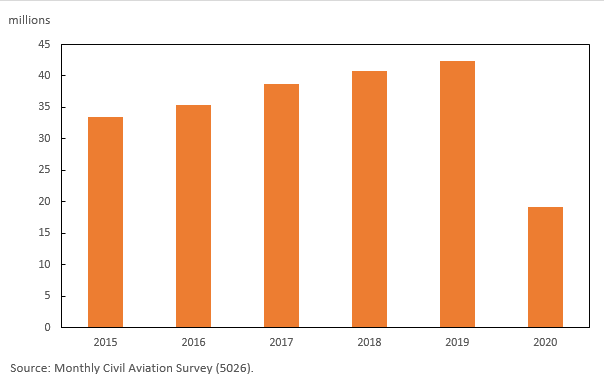
Passengers carried, January to June
Infographic description
The title of the infographic is "Passengers carried, January to June"
This is a column chart.
The vertical axis represents the number of passengers in millions. The vertical axis starts at zero and goes to 45 million with increments of 5 million.
The horizontal axis represents the year and goes from 2015 to 2020 with increments of 1.
In 2015, the column is at 33.5 million passengers.
In 2016, the column is at 35.4 million passengers.
In 2017, the column is at 38.7 million passengers.
In 2018, the column is at 40.9 million passengers.
In 2019, the column is at 42.3 million passengers.
In 2020, the column is at 19.1 million passengers.
Source: Monthly Civil Aviation Survey (5026).
- Date modified: