
Infographic 1
Disruptions to the Canadian airline industry
Infographic description
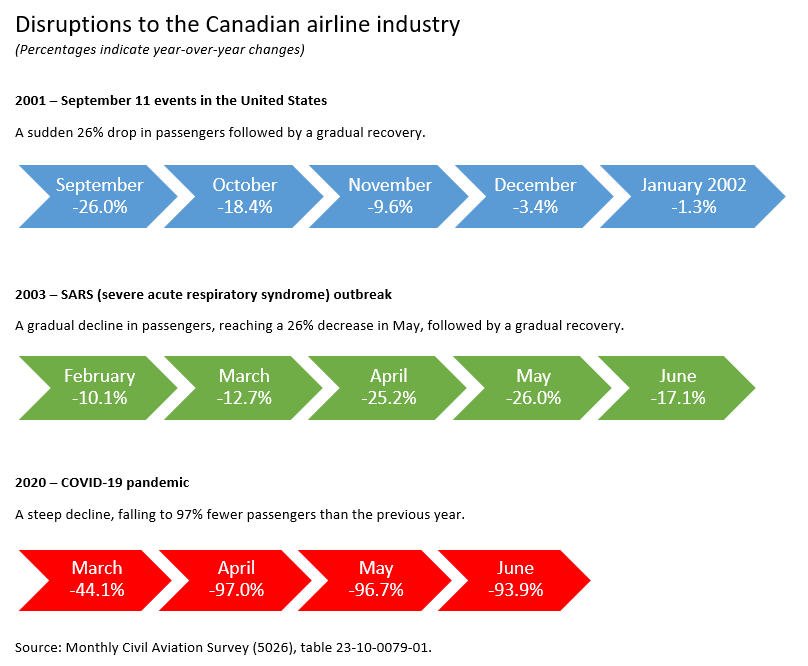
The title of the infographic is "Disruptions to the Canadian airline industry"
In brackets underneath the title it says "Percentages indicate year-over-year changes."
The first subheading is "2001 – September 11 events in the United States". The description under this subheading says "A sudden 26% drop in passengers followed by a gradual recovery."
There are five blue arrows in a row pointing to the right. Each arrow contains one month with the year-over-year percentage change for that month. The first arrow is for the month of September and the change is minus 26.0%. The second arrow is for the month of October and the change is minus 18.4%. The third arrow is for the month of November and the change is minus 9.6%. The fourth arrow is for the month of December and the change is minus 3.4%. The fifth arrow is for the month of January 2002 and the change is minus 1.3%.
The second subheading is "2003 – SARS (severe acute respiratory syndrome) outbreak." The description under this subheading says "A gradual decline in passengers, reaching a 26% decrease in May, followed by a gradual recovery."
There are five green arrows in a row pointing to the right. Each arrow contains one month with the year-over-year percentage change for that month. The first arrow is for the month of February and the change is minus 10.1%. The second arrow is for the month of March and the change is minus 12.7%. The third arrow is for the month of April and the change is minus 25.2%.The fourth arrow is for the month of May and the change is minus 26.0%. The fifth arrow is for the month of June and the change is minus 17.1%.
The third subheading is "2020 – COVID-19 pandemic." The description under this subheading says "A steep decline, falling to 97% fewer passengers than the previous year."
There are four red arrows in a row pointing to the right. Each arrow contains one month with the year-over-year percentage change for that month. The first arrow is for the month of March and the change is minus 44.1%. The second arrow is for the month of April and the change is minus 97.0%. The third arrow is for the month of May and the change is minus 96.7%. The fourth arrow is for the month of June and the change is minus 93.9%.
Source(s): Monthly Civil Aviation Survey (5026), table 23-10-0079-01.
- Date modified: