Infographic 2
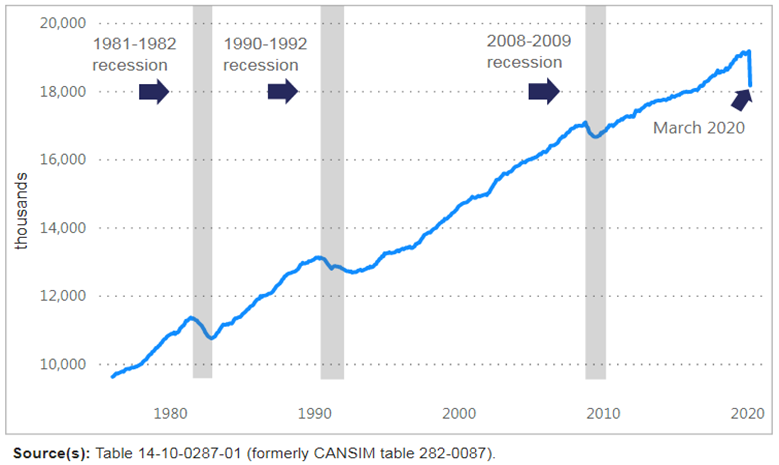
Magnitude of this unprecedented employment change compared with past shocks

Infographic description
The title of the infographic is "Magnitude of this unprecedented employment change compared with past shocks"
This is a linear chart.
The horizontal axis shows thousands from 10,000 to 20,000 by increments of 2,000.
The vertical axis shows the first of every month from January 1, 1976, to March 1, 2020, by increments of 10 years.
There are three vertical bars in the chart, showing the 1981-1982 recession, the 1990-1992 recession and the 2008-2009 recession.
The chart shows a drop in employment from 19.2 million on February 1, 2020, to 18.2 million on March 1, 2020.
Source: Table 14-10-0287-01.
- Date modified: