Infographic 1
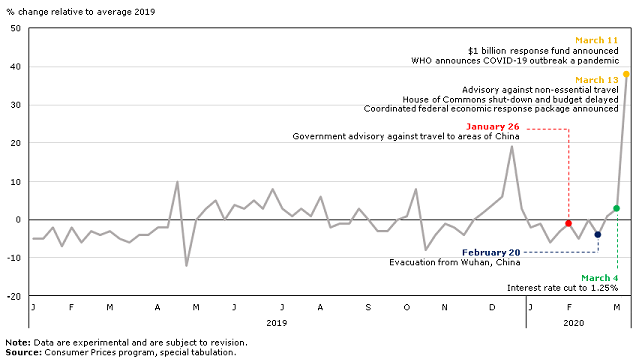
Weekly percent change in sales for select grocery retailers, relative to 2019 average

Infographic description
The title of the infographic is "Weekly percent change in sales for select grocery retailers, relative to 2019 average"
This is a line chart with a single series.
The left-side y axis represents weekly percentage change in sales at selecct grocery stores in Canada relative to the average of sales in 2019.
The x axis represents weekly periods, and goes from January 2019 to the week ending March 14, 2020, with increments of 1, to a total of 63 weeks.
At the period week 1 the series is at -5.
At the period week 2 the series is at -5.
At the period week 3 the series is at -2.
At the period week 4 the series is at -7.
At the period week 5 the series is at -2.
At the period week 6 the series is at -6.
At the period week 7 the series is at -3.
At the period week 8 the series is at -4.
At the period week 9 the series is at -3.
At the period week 10 the series is at -5.
At the period week 11 the series is at -6.
At the period week 12 the series is at -4.
At the period week 13 the series is at -4.
At the period week 14 the series is at -2.
At the period week 15 the series is at -2.
At the period week 16 the series is at 10.
At the period week 17 the series is at -12.
At the period week 18 the series is at 0.
At the period week 19 the series is at 3.
At the period week 20 the series is at 5.
At the period week 21 the series is at 0.
At the period week 22 the series is at 4.
At the period week 23 the series is at 3.
At the period week 24 the series is at 5.
At the period week 25 the series is at 3.
At the period week 26 the series is at 8.
At the period week 27 the series is at 3.
At the period week 28 the series is at 1.
At the period week 29 the series is at 3.
At the period week 30 the series is at 1.
At the period week 31 the series is at 6.
At the period week 32 the series is at -2.
At the period week 33 the series is at -1.
At the period week 34 the series is at -1.
At the period week 35 the series is at 3.
At the period week 36 the series is at 0.
At the period week 37 the series is at -3.
At the period week 38 the series is at -3.
At the period week 39 the series is at 0.
At the period week 40 the series is at 1.
At the period week 41 the series is at 8.
At the period week 42 the series is at -8.
At the period week 43 the series is at -4.
At the period week 44 the series is at -1.
At the period week 45 the series is at -2.
At the period week 46 the series is at -4.
At the period week 47 the series is at 0.
At the period week 48 the series is at 2.
At the period week 49 the series is at 4.
At the period week 50 the series is at 6.
At the period week 51 the series is at 19.
At the period week 52 the series is at 3.
At the period week 53 the series is at -2.
At the period week 54 the series is at -1.
At the period week 55 the series is at -6.
At the period week 56 the series is at -3.
At the period week 57 the series is at -1. There is a call out at this point with the text "January 26, Government advisory against travel to areas of China."
At the period week 58 the series is at -5.
At the period week 59 the series is at 0.
At the period week 60 the series is at -4. There is a call out at this point with the text "February 20, Evacuation from Wuhan, China."
At the period week 61 the series is at 1.
At the period week 62 the series is at 3. There is a call out at this point with the text "March 4, Interest rate cut to 1.25%."
At the period week 63 the series is at 38. There is a call out at this point with the text "March 11, $1 billion response fund announced. WHO announces COVID-19 outbreak a pandemic. March 13, Advisory against non-essential travel. House of Commons shut-down and budget delayed. Coordinated federal economic response package announced."
- Date modified: