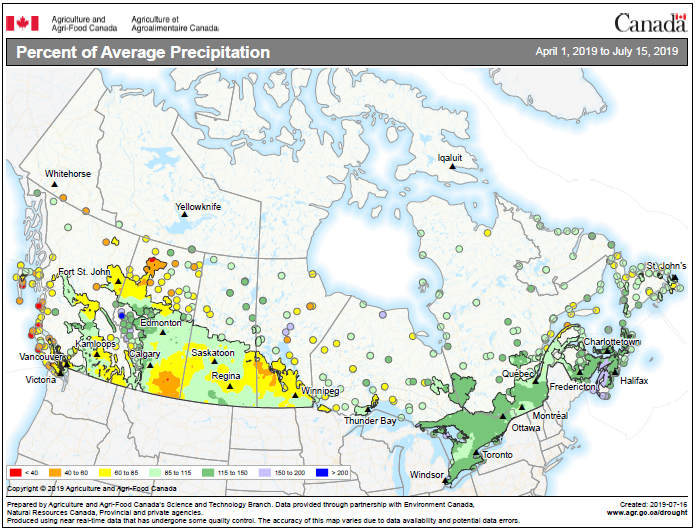
Map 2
Percent of average precipitation from April 1 to July 15, 2019 (during the growing season), compared with annual average, by province

Map description
The title of the map is "Percent of average precipitation from April 1 to July 15, 2019 (during the growing season), compared with annual average, by province"
This map shows precipitation below normal through much of British Columbia and southern Alberta, normal in central Alberta and much of Saskatchewan, and below normal for much of Manitoba, and above normal in Ontario, Quebec, and most of Atlantic Canada.
- Date modified: