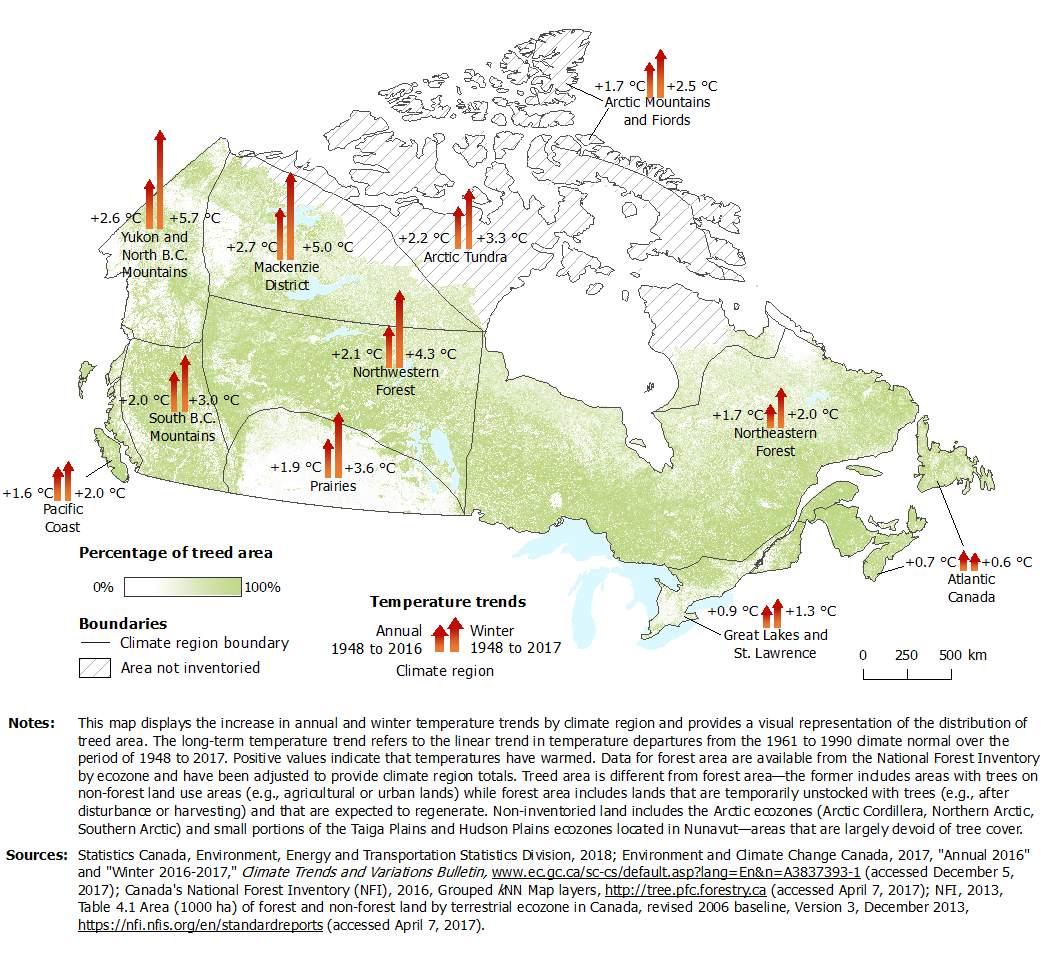
Map 2
Treed area and long-term temperature trends by climate region

Map description
The title of the map is "Treed area and long-term temperature trends by climate region"
This map displays the increase in annual and winter temperature trends by climate region, as well as the percentage of treed area.
On this map, temperature trends are shown using a set of red arrow icons for each of eleven climate regions. The arrow icon on the left represents annual temperature trends from 1948 to 2016 while the arrow icon on the right represents winter temperature trends from 1948 to 2017. The temperature trend is posted next to each arrow and the climate region name appears below each pair of arrows.
The colour ranges on a scale from white (0%) through light green (50%) to green (100%). Water is pale blue
A solid black lines outlines climate region boundaries. Non-inventoried areas are shown in white with grey diagonal lines—there is no data for these areas.
Climate regions that experienced the largest increases in the long-term annual temperature trend were Mackenzie District and Yukon and North B.C. Mountains, while those with the smallest increases were Atlantic Canada and Great Lakes and St. Lawrence. The largest increases in the long-term winter temperature trend were Yukon and North B.C. Mountains and the Mackenzie District followed by Northwestern Forest. Climate regions with the most treed area include Northeastern Forest and Northwestern Forest followed by Mackenzie District.
Long-term temperature trends and forest area by climate region:
Arctic Mountains and Fiords: Annual 1948 to 2016: +1.7°C; Winter 1948 to 2017: +2.5°C; Forest area, 2006: 576 km2
Arctic Tundra: Annual 1948 to 2016: +2.2°C; Winter 1948 to 2017: +3.3°C; Forest area, 2006: 46,026 km2
Atlantic Canada: Annual 1948 to 2016: +0.7°C; Winter 1948 to 2017: +0.6°C; Forest area, 2006: 173,370 km2
Great Lakes and St. Lawrence: Annual 1948 to 2016: +0.9°C; Winter 1948 to 2017: +1.3°C; Forest area, 2006: 92,359 km2
Mackenzie District: Annual 1948 to 2016: +2.7°C; Winter 1948 to 2017: +5.0°C; Forest area, 2006: 388,751 km2
Northeastern Forest: Annual 1948 to 2016: +1.7°C; Winter 1948 to 2017: +2.0°C; Forest area, 2006: 1,317,441 km2
Northwestern Forest: Annual 1948 to 2016: +2.1°C; Winter 1948 to 2017: +4.3°C; Forest area, 2006: 738,947 km2
Pacific Coast: Annual 1948 to 2016: +1.6°C; Winter 1948 to 2017: +2.0°C; Forest area, 2006: 66,752 km2
Prairies: Annual 1948 to 2016: +1.9°C; Winter 1948 to 2017: +3.6°C; Forest area, 2006: 71,292 km2
South British Columbia Mountains: Annual 1948 to 2016: +2.0°C; Winter 1948 to 2017: +3.0°C; Forest area, 2006: 318,113 km2
Yukon and North British Columbia Mountains: Annual 1948 to 2016: +2.6°C; Winter 1948 to 2017: +5.7°C; Forest area, 2006: 262,130 km2
Notes: This map displays the increase in annual and winter temperature trends by climate region and provides a visual representation of the distribution of treed area. The long-term temperature trend refers to the linear trend in temperature departures from the 1961 to 1990 climate normal over the period of 1948 to 2017. Positive values indicate that temperatures have warmed. Data for forest area are available from the National Forest Inventory by ecozone and have been adjusted to provide climate region totals. Treed area is different from forest area—the former includes areas with trees on non-forest land use areas (e.g., agricultural or urban lands) while forest area includes lands that are temporarily unstocked with trees (e.g., after disturbance or harvesting) and that are expected to regenerate. Non-inventoried land includes the Arctic ecozones (Arctic Cordillera, Northern Arctic, Southern Arctic) and small portions of the Taiga Plains and Hudson Plains ecozones located in Nunavut—areas that are largely devoid of tree cover.
Sources: Statistics Canada, Environment, Energy and Transportation Statistics Division, 2018; Environment and Climate Change Canada, 2017, "Annual 2016" and "Winter 2016-2017,"
- Date modified: