
Infographic 1
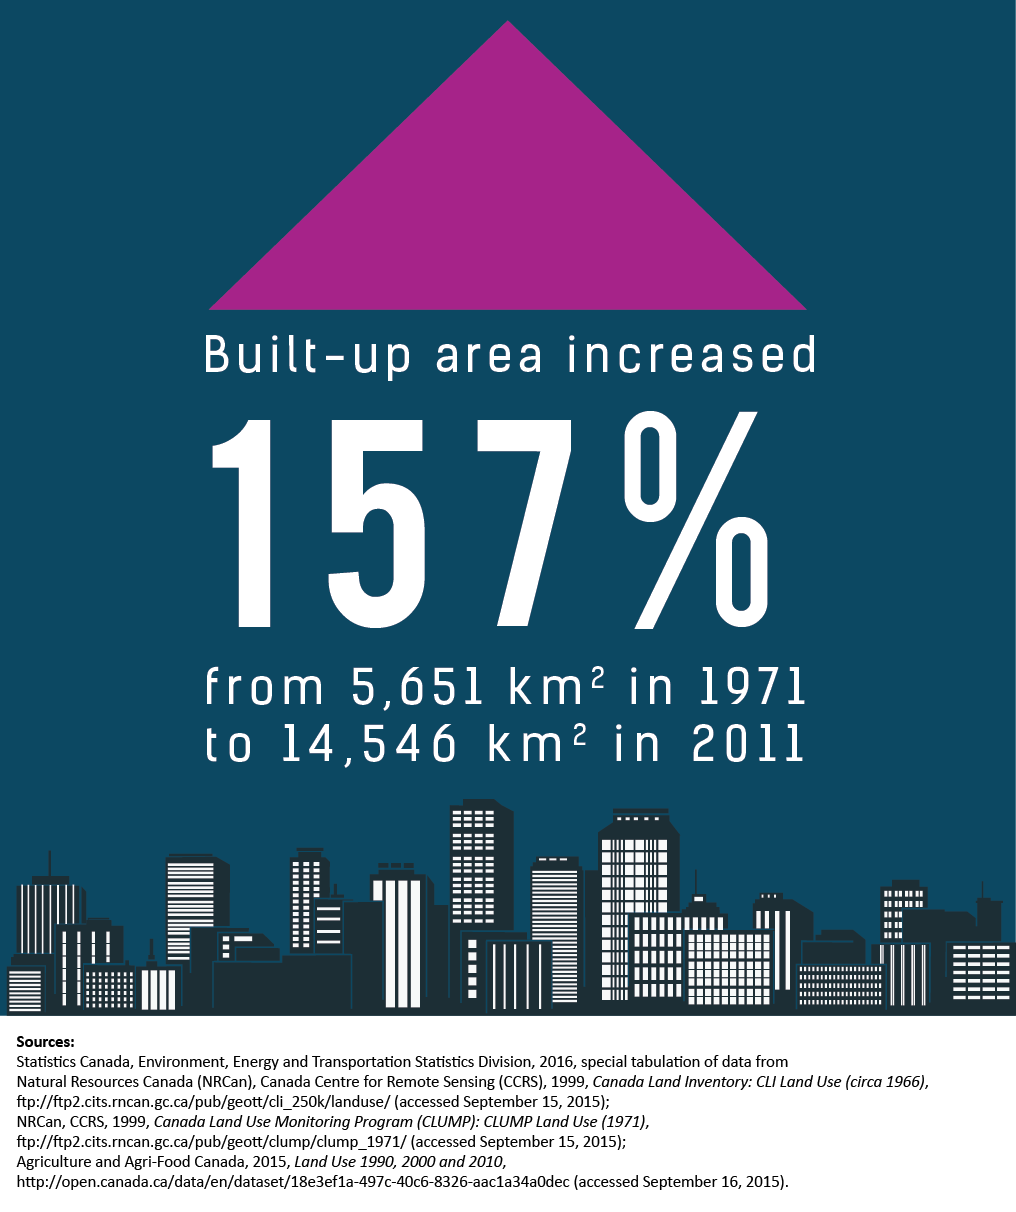
Built-up area growth, census metropolitan areas of Canada, 1971 to 2011
Infographic description
The title of the infographic is "Built-up area growth, census metropolitan areas of Canada, 1971 to 2011"
Built-up area increased 157% from 5 651 km2 in 1971 to 14 546 km2 in 2011.
Source(s):
Statistics Canada, Environment, Energy and Transportation Statistics Division, 2016, special tabulation of data from Natural Resources Canada (NRCan), Canada Centre for Remote Sensing (CCRS), 1999,
- Date modified: