Payroll employment, earnings and hours, September 2012

Archived Content
Information identified as archived is provided for reference, research or recordkeeping purposes. It is not subject to the Government of Canada Web Standards and has not been altered or updated since it was archived. Please "contact us" to request a format other than those available.
Related subjects
-
[an error occurred while processing this directive]
In September, average weekly earnings of non-farm payroll employees were $902.29, down 0.5% from the previous month. On a year-over-year basis, earnings increased 3.4%.
Year-over-year change in average weekly earnings and average weekly hours
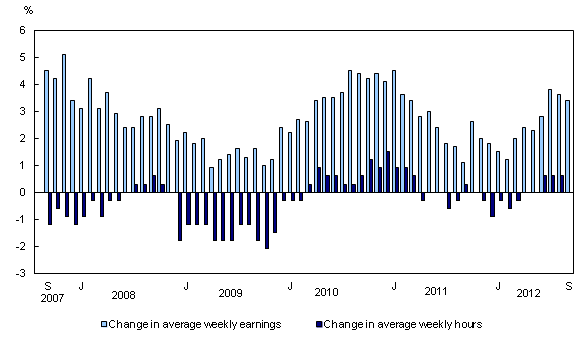
Chart description: Year-over-year change in average weekly earnings and average weekly hours
The 3.4% increase in earnings during the 12 months to September reflects a number of factors, including wage growth, changes in the composition of employment by industry, occupation and level of job experience, as well as average hours worked per week. In September, however, the average hours worked per week was 33.0, unchanged from 12 months earlier, and down from 33.1 in August.
Average weekly earnings by sector
Year-over-year growth in average weekly earnings outpaced the national average of 3.4% in three of the largest industrial sectors: manufacturing; retail trade; and professional, scientific and technical services.
Year-over-year change in average weekly earnings in the 10 largest sectors, September 2011 to September 2012
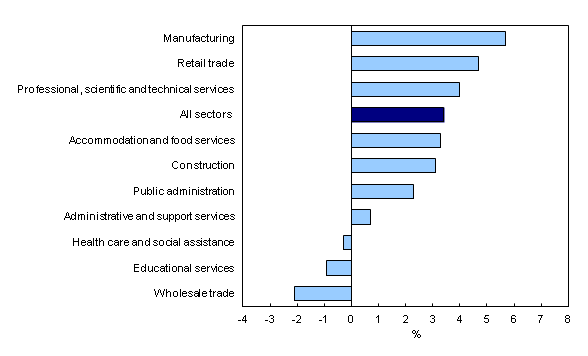
Average weekly earnings in manufacturing increased 5.7% to $1,026.45 in the 12 months to September, mostly in primary metal; transportation equipment; wood products; computer and electronic products; and plastics and rubber products.
In retail trade, weekly earnings increased 4.7% to $530.10. Growth was most notable in general merchandise stores; health and personal care stores; motor vehicle and parts dealers; food and beverage stores; and building material and garden equipment and supplies.
Weekly earnings in professional, scientific and technical services rose 4.0% to $1,276.62. Gains occurred in advertising, public relations and related services; architectural, engineering and related services; legal services; and scientific research and development services.
Average weekly earnings up in every province
Average weekly earnings of non-farm payroll employees increased in every province in the 12 months to September. Growth was notably above the national average in Newfoundland and Labrador and Nova Scotia.
Year-over-year growth in average weekly earnings by province, September 2011 to September 2012
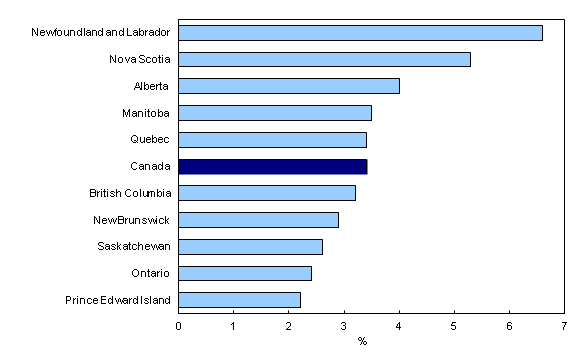
In Newfoundland and Labrador, average weekly earnings were $945.16 in September, up 6.6% from 12 months earlier. This was the fourth consecutive year-over-year increase above 6%. Weekly earnings in the province were among the highest in the country.
In Nova Scotia, average weekly earnings increased 5.3% to $802.49 in the 12 months to September. Despite this increase, earnings in this province were among the lowest.
Alberta continued to have the highest earnings in the country, at $1,085.22, which was 4.0% above the level in September 2011.
Weekly earnings in Ontario grew 2.4% to $908.59. Year-over-year growth in Ontario has been below the national average since October 2010 (see the "Provincial profile" section of this release).
Non-farm payroll employment by sector
Total non-farm payroll employment declined by 52,500 from August to September, following six consecutive monthly increases.
In September, the number of payroll employees declined in most sectors, with the largest declines in manufacturing; accommodation and food services; administrative and support services; and 'other services.'
On a year-over-year basis, payroll employment rose by 235,400 (+1.6%), with the bulk of these gains occurring between February and August.
Among all sectors, mining, quarrying, and oil and gas extraction continued to post the highest 12-month payroll employment growth rate, at 8.8% in September. It was followed by construction (+4.2%); transportation and warehousing (+3.4%); educational services (+3.2%); and accommodation and food services (+2.5%).
Provincial profile: Ontario
From time to time, this release profiles an industrial sector or a province with a notable trend in employment, earnings or hours. This month, the focus is on Ontario, which, over the past two years, has had below-average growth in employment and earnings.
In September, there were 5.8 million non-farm payroll employees in Ontario, representing 38.0% of all employees in Canada. Ontario's share of national payroll employment has been declining since 2003. At the same time, the shares of Alberta, British Columbia and Saskatchewan have been increasing.
Ontario's manufacturing sector saw a large decline in the number of employees between 2003 and the labour market downturn of 2008 and 2009. Since that time, employment in this sector has been relatively stable. There were 654,200 employees in this sector in September 2012, compared with 908,900 in January 2003.
Since 2009, retail trade has replaced manufacturing as the top employer, with 677,300 employees in September 2012. Manufacturing remains the second-largest employer, followed by health care and social assistance, with 620,100 employees.
In the 12 months to September 2012, payroll employment in Ontario rose 1.0% (+58,500), below the national average of 1.6%. The largest increases were in education; retail trade; transportation and warehousing; information and culture; and health care and social assistance. At the same time, there were declines in public administration and utilities.
Average weekly earnings in Ontario increased to $908.59 in September, up 2.4% from the previous 12 months, compared with a 3.4% increase nationally. Following little growth throughout 2011, earnings growth trended upward from February to July 2012, but has since stabilized.
Average weekly earnings growth for Ontario and Canada based on current dollars from January 2008 to September 2012
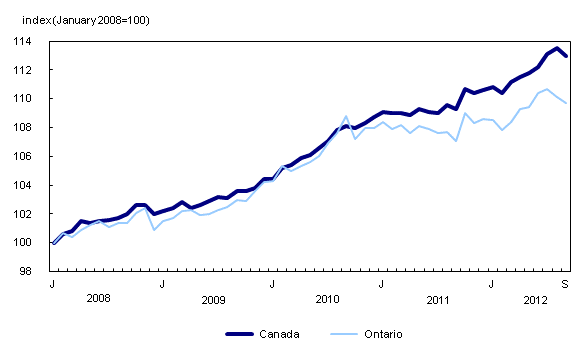
Compared with other provinces, Ontario posted the fourth-highest earnings level in September, in contrast to the early 2000s, when it had the highest. Earnings levels have been the highest in Alberta since 2005. Since the end of 2011, average weekly earnings in Newfoundland and Labrador and Saskatchewan have surpassed those in Ontario.
In the 12 months to September, the highest increases in average weekly earnings in Ontario's larger sectors were in finance and insurance; retail trade; manufacturing; and health care and social assistance. At the same time, earnings declined in wholesale trade; administrative and support services; and construction.
In September, Ontario employees worked an average of 33.0 hours per week, down from 33.3 hours in the same month a year earlier.
Ontario had the highest average hours worked per week in the country from 2001 to 2007. However, from 2007 to 2009, its average weekly hours declined from 34.0 to 32.9. For the past three years, they have been fluctuating between 33.0 and 33.5.
In contrast, average weekly hours in Alberta and in Newfoundland and Labrador have increased. These two provinces now have the highest averages, at 34.6 and 34.0, respectively.
Note to readers
The Survey of Employment, Payrolls and Hours (SEPH) is a business census of non-farm payroll employees. Its key objective is to provide a monthly portrait of the level of earnings, the number of jobs and hours worked by detailed industry at the national, provincial and territorial level.
Data on average weekly earnings and hours are based on a sample and are therefore subject to sampling variability. Payroll employment data are based on a census of administrative data and are not subject to sampling variability.
Statistics Canada also produces employment data from its monthly Labour Force Survey (LFS). The LFS is a household survey, the main objective of which is to divide the working-age population into three mutually exclusive groups: the employed (including the self-employed), unemployed and not in the labour force. This survey is the official source for the unemployment rate and collects data on the socio-demographic characteristics of all those in the labour market.
As a result of conceptual and methodological differences, data on changes from SEPH and LFS do differ from time to time. However, the trends in the data are quite similar.
Unless otherwise stated, this release presents seasonally adjusted data, which facilitates comparisons by removing the effects of seasonal variations. For more information on seasonal adjustment, see Seasonal adjustment and identifying economic trends.
Non-farm payroll employment data are for all hourly and salaried employees, as well as the "other employees" category, which includes piece-rate and commission-only employees.
Average weekly hours data are for hourly and salaried employees only and exclude businesses that could not be classified to a North American Industry Classification System (NAICS) code.
All earnings data include overtime pay and exclude businesses that could not be classified to a NAICS code. Earnings data are based on gross taxable payroll before source deductions.
Average weekly earnings are derived by dividing total weekly earnings by the number of employees.
With each release, data for the current reference month are subject to revision. Data have been revised for the previous month. Users are encouraged to request and use the most up-to-date data for each month.
Data on the education sector
Changes for educational services during the summer months can be affected by changes in payment schedules and school-year calendars. Month-to-month changes should therefore be interpreted with caution, and more attention given to long-term trends.
Available without charge in CANSIM: tables CANSIM table281-0023 to 281-0039 and CANSIM table281-0041 to 281-0049.
Definitions, data sources and methods: survey number survey number2612.
A data table is available from the Key resource module of our website under Summary tables.
Detailed industry data, data by size of enterprise based on employment, and other labour market indicators will soon be available in the monthly publication Employment, Earnings and Hours, Vol. 90, no. 9 (Catalogue number72-002-X, free).
Data on payroll employment, earnings and hours for October will be released on December 20.
For more information, contact us (toll-free 1-800-263-1136; infostats@statcan.gc.ca).
To enquire about the concepts, methods or data quality of this release, contact Jeannine Usalcas (613-951-4720; jeannine.usalcas@statcan.gc.ca), Labour Statistics Division.
- Date modified: