Canadian international merchandise trade: Annual review, 2011

Archived Content
Information identified as archived is provided for reference, research or recordkeeping purposes. It is not subject to the Government of Canada Web Standards and has not been altered or updated since it was archived. Please "contact us" to request a format other than those available.
Related subjects
-
[an error occurred while processing this directive]
In 2011, Canada's international merchandise trade experienced a second consecutive year of gains, following the large decrease recorded in 2009, bringing Canada's total trade—exports and imports combined—within 2.0% of the record levels posted in 2008. Canada's reliance on the United States as a trading partner continued to decline, as Asia and Europe gained further ground.
Canada's exports totalled $457.6 billion in 2011, an increase of 13.0% from 2010, as prices rose 8.6%. Imports increased 10.3% from 2010 to $456.4 billion, mainly on the strength of volumes, which were up 8.3%.
Export and import levels
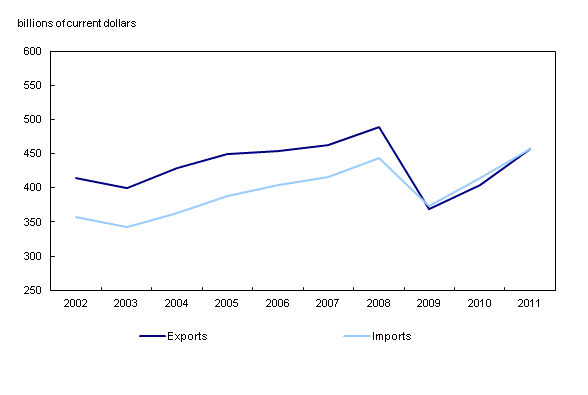
Chart description: Export and import levels
Canada's trade balance went from a deficit of $9.0 billion in 2010 to a surplus of $1.2 billion in 2011, marking Canada's first annual trade surplus since 2008.
China and the United Kingdom's share of exports increase
Export levels to the United States in 2011 were just below those recorded a decade earlier, while exports to the United Kingdom and China grew more than four-fold from 2002 to 2011. As a result, the share of exports to the United States has declined whereas the respective shares of exports to the United Kingdom and China have more than tripled.
Exports to the United States increased to $330.1 billion in 2011, up 10.4% from 2010. Gains were led by crude petroleum exports, which rose 32.3% to a record $68.4 billion. The United States accounted for 73.7% of total exports in 2011, down from 87.1% in 2002.
Exports to the United Kingdom increased 14.8% in 2011 to a record high of $18.8 billion. Precious metals and alloys, which represented over 60% of Canadian exports to the United Kingdom in 2011, led the gains.
Exports to China amounted to $16.8 billion, up 26.9% from 2010. Exports of iron ores and concentrates recorded the largest gains. Wood pulp and similar pulp remained the top export for a second consecutive year.
United States now accounts for less than half of total imports
Between 2002 and 2011, the share of goods imported from the United States declined from 62.6% to 49.5%. In contrast, China's share of imports has shown the largest gains, increasing from 4.6% in 2002 to 10.8% in 2011.
The value of imports from the United States increased 8.6% from 2010 to $220.8 billion. Gains were led by imports of fuel oils, and other petroleum and coal products, both reaching record highs.
China remained Canada's second-largest source of imports for the 10th consecutive year. Imports from China amounted to $48.2 billion in 2011, an 8.1% increase from 2010. Electronic computers and other telecommunications and related equipment, including cellular telephones, have driven the growth of imports from China over the past decade.
Mexico remained the third-largest source of imports for the Canadian market in 2011, at $24.6 billion, up 11.1% from 2010. Automotive products, mainly motor vehicle parts, except engines, led the rise.
Note to readers
Merchandise trade is one component of Canada's international balance of payments current account, which also includes trade in services, investment income, current transfers as well as capital and financial flows.
International merchandise trade data on total trade and trade balances are presented on a balance of payments (BOP) basis while the country data are presented on a customs basis. BOP data are derived from customs data by making adjustments for characteristics such as valuation, coverage, timing and residency. These adjustments are made to conform to the concepts and definitions of the Canadian System of National Accounts.
Revisions
The previous year's customs data are revised with the release of the January and February reference months as well as on a quarterly basis. The previous two years of customs based data are revised annually and are released in February with the December reference month.
The previous year's BOP based data are revised with the release of the January, February, March and April 2012 reference months.
Factors influencing revisions include late receipt of import and export documentation, incorrect information on customs forms, replacement of estimates produced for the energy sector with actual figures, changes in classification of merchandise based on more current information, and changes to seasonal adjustment factors.
Revised data are available in the appropriate CANSIM tables, free of charge.
Available without charge in CANSIM: tables CANSIM table228-0003, CANSIM table228-0043, CANSIM table228-0049 and CANSIM table228-0055.
The merchandise imports and exports data in the following tables are presented in dollar values.
Table 228-0003: Customs and balance of payments basis, by major groups and principal trading areas for all countries; annual.
Table 228-0043: Customs and balance of payments basis, by sector and sub-sector, for all countries; annual.
The merchandise imports and exports data in the following tables are indexes (2002=100).
Table 228-0049: Balance of payments and customs-based price and volume indexes for all countries; annual.
Table 228-0055: Price and volume indexes customs and balance of payments basis, by sector and sub-sector, for all countries; annual.
Definitions, data sources and methods: survey numbers survey number2201, survey number2202 and survey number2203.
The publication International Merchandise Trade Annual Review, 2011 (Catalogue number65-208-X, free), is now available online from the Key resource module of our website under Publications.
Data on Canadian international merchandise trade for February will be released on April 12.
For more information, contact Statistics Canada's National Contact Centre (toll-free 1-800-263-1136; 613-951-8116; infostats@statcan.gc.ca).
To enquire about the concepts, methods or data quality of this release, contact Cameron Crompton (613-951-2555), International Trade Division.
- Date modified: