Canada's balance of international payments

Archived Content
Information identified as archived is provided for reference, research or recordkeeping purposes. It is not subject to the Government of Canada Web Standards and has not been altered or updated since it was archived. Please "contact us" to request a format other than those available.
Related subjects
-
[an error occurred while processing this directive]
Canada's overall current account deficit (on a seasonally adjusted basis) widened by $5.3 billion to reach $15.3 billion in the second quarter. This deterioration in the current account balance was largely equivalent to the change in the trade in goods balance from a $1.8 billion surplus to a $3.5 billion deficit, as imports increased further and exports declined.

Chart description: Current account balances
Note to readers
The balance of international payments covers all economic transactions between Canadian residents and non-residents in two accounts, the current account and the capital and financial account.
The current account covers transactions in goods, services, investment income and current transfers.
The capital and financial account is mainly comprised of transactions in financial assets and liabilities.
In principle, a current account surplus/deficit corresponds to an equivalent net outflow/inflow in the capital and financial account. In practice, as international transactions data are compiled from multiple sources, this is rarely the case and gives rise to measurement error. The statistical discrepancy is the unobserved net inflow or outflow.
For more information about the balance of payments, consult the "Frequently asked questions" section in the National economic accounts module of our website. The module also presents the most recent balance of payments statistics.
In the capital and financial account (unadjusted for seasonal variation), non-residents continued to supply funds to the Canadian economy, largely through purchases of Canadian debt securities. This resulted in a 10th straight quarterly investment in Canadian securities. Foreign direct investment in Canada was up in the second quarter, reflecting an acceleration of merger and acquisition activity.
Current account
Goods balance back to deficit
The overall balance on the trade in goods returned to a deficit after two quarters in surplus, with a deficit of $3.5 billion in the second quarter. The trade surplus with United States fell by $3.3 billion in the second quarter, following a $4.9 billion increase the previous quarter. While imports from the United States expanded, exports were down on lower values for crude petroleum and automobiles.
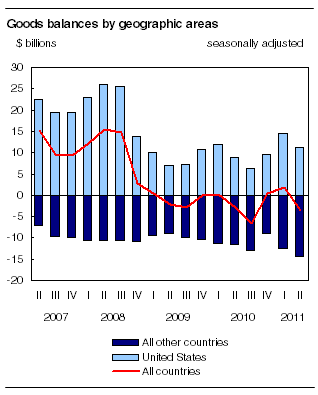
Chart description: Goods balances by geographic areas
Exports of goods declined $1.6 billion to $109.9 billion in the second quarter. Exports of crude petroleum were down $2.0 billion on lower volumes, as prices stabilised following gains of close to 35% over the previous two quarters. This was partially offset by increased exports of coal and natural gas, largely reflecting higher prices.
Automobile exports were down $0.8 billion. Exports of agricultural products and industrial goods were up slightly. Within industrial goods, higher exports of chemicals, plastics and fertilizers were partially offset by lower exports of precious metals. Exports of machinery and equipment edged down, while aircraft exports were at their lowest value in 13 years.
Imports of goods expanded $3.7 billion in the second quarter to reach $113.4 billion. Industrial goods imports were up $1.5 billion, mainly on higher volumes of metals and metal ores. Energy products increased $1.4 billion as petroleum and coal products continued to grow, up more than 80% over the last three quarters. Higher imports of drilling and mining machinery led the $1.3 billion increase in machinery and equipment. Automotive products were down $1.2 billion.
Increase in the deficit on trade in services led by transportation and travel
In the second quarter, the travel and transportation deficits both increased for the fourth time in five quarters. The travel deficit was up $0.1 billion as Canadian spending abroad outpaced spending in Canada by foreign travellers. The deficit on transportation services widened by $0.3 billion, led by higher payments on air fares. However, the commercial services deficit remained unchanged. The overall deficit in trade in services reached a new high of $6.2 billion in the second quarter.
Investment income deficit down on higher receipts
The deficit in investment income narrowed by $0.4 billion to $4.7 billion in the second quarter, led by receipts. Earnings on Canadian direct investment abroad were up $0.4 billion through higher dividends during the second quarter. Receipts on portfolio investment remained stable as higher dividends were offset by lower interest on foreign bonds.
On the payments side, dividends from portfolio investments and interest paid on Canadian bonds were both up slightly. Profits earned in Canada by foreign direct investors edged down in the second quarter.
Foreign investors favour Canadian debt instruments
The trend to foreign acquisition of Canadian securities continued in the second quarter as non-residents investors added a further $19.4 billion to their portfolios, marking the 10th straight quarter of such investment. Non-resident purchases of Canadian securities amounted to $270.2 billion over this period, with over three-quarters directed to the Canadian bond market.
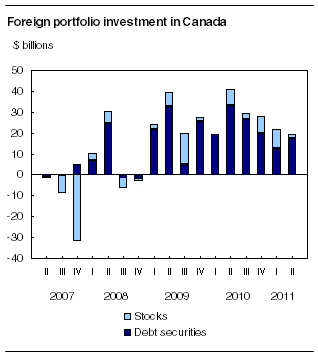
Chart description: Foreign portfolio investment in Canada
Foreign investment in Canadian securities again focused on bonds in the second quarter, with acquisitions of $11.9 billion. Retirements of Canadian bonds, mostly in June, moderated the overall inflows over the quarter. Foreign investment in federal government enterprise bonds led the purchases in the quarter. Non-residents also continued to add federal and provincial government bonds to their holdings, despite increased retirements in these instruments.
Foreign investors acquired $5.4 billion of Canadian money market instruments in the second quarter. Federal Treasury bills accounted for most of the investment, with foreign holdings of these instruments reaching their highest level since 1996. This was the largest such inflow since the first quarter of 2009, following the weakening of the economy and of global stock markets at the end of 2008.
Non-residents also acquired $2.1 billion of Canadian equities in the second quarter, down from $9.3 billion in the first quarter. Investment activity in the quarter arose from secondary market purchases, as Canadian stock prices declined further in the quarter to reach their lowest level since November 2010.
Canadian investors acquire foreign corporate shares and sell foreign bonds
Canadian investment in foreign securities slowed to $1.3 billion in the second quarter, as purchases of foreign stocks were largely offset by a reduction in holdings of both long and short-term foreign debt instruments. Canadian investors added $10.3 billion of foreign corporate shares to their portfolios in the second quarter, the largest such investment since the first quarter of 2009. US stocks accounted for three-quarters of these acquisitions, the highest in over three years. The Standard and Poor's 500 composite index fell 0.6% in the quarter, led by the energy and banking sectors.
Canadians reduced their holdings of foreign bonds by a further $8.0 billion in the second quarter. US Treasury bonds and, to a lesser extent, net retirements of maple bonds accounted for most of the divestment in the quarter. Purchases of bonds from Japan and other Organisation of Economic Co-operation and Development countries moderated this activity. In addition, residents removed US Treasury bills from their portfolios for a third straight quarter, as short-term interest rates in the United States remained at historical lows.
Foreign direct investment in Canada increases as a result of foreign takeovers
Foreign direct investors continued to inject funds into the Canadian economy in the second quarter with an additional inflow of $14.5 billion, after two quarters of investment totalling $23.5 billion. Cross-border merger and acquisition activity strengthened further in the quarter, accounting for the bulk of the investment. US direct investors led the investment, which was concentrated in the Canadian energy and metallic mineral sectors.
Funds sent abroad by Canadian direct investors slowed to $4.6 billion in the second quarter. Investment was mostly directed to the finance and insurance sectors. Despite reduced activity in the quarter, Canadian direct investment abroad for the first six months of 2011 exceeded that of the same period in each of the previous two years.
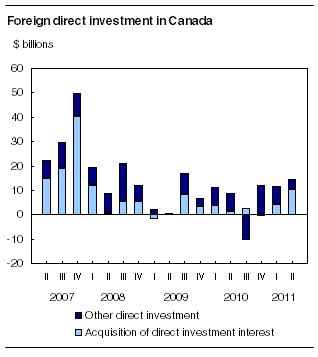
Chart description: Foreign direct investment in Canada
Available on CANSIM: tables 376-0001 to 376-0017 and 376-0035.
Definitions, data sources and methods: survey numbers, including related surveys, 1534, 1535, 1536 and 1537.
The second quarter 2011 issue of Canada's Balance of International Payments (67-001-X, free) will be available soon.
The balance of international payments data for the third quarter will be released on November 29.
For more information, or to order data, contact Client Services (613-951-1855; infobalance@statcan.gc.ca). To enquire about the concepts, methods or data quality of this release, contact Denis Caron (613-951-1861; denis.caron@statcan.gc.ca), Balance of Payments Division.
- Date modified: