


Statistics Canada
www.statcan.gc.ca
Common menu bar links
Retail trade

Archived Content
Information identified as archived is provided for reference, research or recordkeeping purposes. It is not subject to the Government of Canada Web Standards and has not been altered or updated since it was archived. Please "contact us" to request a format other than those available.
Related subjects
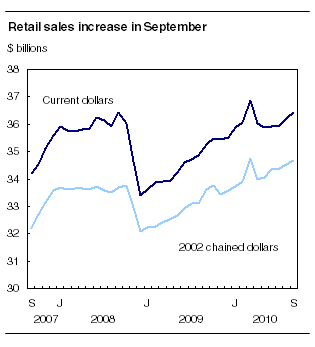
Retail sales increased for the fourth consecutive month, rising 0.6% in current dollars to $36.4 billion in September. Gains were reported in 8 of 11 subsectors.
Retail sales in volume terms were up 0.4%. Retail sales have been following an upward trend since the beginning of 2009.
The largest increase in dollar terms among all subsectors was a 1.2% advance at motor vehicle and parts dealers, which was a fourth consecutive monthly gain. New car dealers reported gains of 1.5%, reflecting higher sales of new motor vehicles according to the New Motor Vehicle Sales Survey. Sales increased 2.2% at used car dealers and 0.1% at automotive parts, accessories and tire stores, while they fell 1.4% at other motor vehicle dealers.
The 2.0% gain at general merchandise stores, which includes department stores, represents a third consecutive monthly increase in sales.
Higher sales were reported at sporting goods, hobby, book and music stores (+2.3%).
Sales increased 1.0% in the clothing and clothing accessories stores subsector. Higher sales at clothing stores (+1.0%) and shoe stores (+3.2%) offset a decline at jewellery, luggage and leather goods stores (-1.0%).
The largest decrease was a 1.6% decline at building material and garden equipment and supplies dealers. Sales at this store type have been trending downward after strong sales in the early part of the year.
Sales up in most provinces
Sales were up in seven provinces in September. The largest contributor to the national increase was Quebec (+0.9%), where sales rose for a third consecutive month.
Sales rose 0.5% in Ontario, a second monthly increase, following flat sales in June and July.
Retailers in Alberta (+0.9%) registered gains for a fourth consecutive month.
Sales in British Columbia advanced 0.6%. This was the first notable increase since May 2010.
The largest decline occurred in Newfoundland and Labrador, where sales fell 0.9%.
Table 1
| September 2009 | August 2010r | September 2010p | August to September 2010 | September 2009 to September 2010 | |
|---|---|---|---|---|---|
| Seasonally adjusted | |||||
| $ millions | % change | ||||
| Canada | 35,259 | 36,203 | 36,418 | 0.6 | 3.3 |
| Newfoundland and Labrador | 607 | 616 | 611 | -0.9 | 0.5 |
| Prince Edward Island | 146 | 145 | 147 | 1.2 | 0.7 |
| Nova Scotia | 1,033 | 1,054 | 1,058 | 0.3 | 2.4 |
| New Brunswick | 882 | 873 | 872 | 0.0 | -1.1 |
| Quebec | 7,992 | 8,137 | 8,211 | 0.9 | 2.7 |
| Ontario | 12,532 | 12,897 | 12,959 | 0.5 | 3.4 |
| Manitoba | 1,266 | 1,333 | 1,328 | -0.3 | 4.9 |
| Saskatchewan | 1,234 | 1,263 | 1,273 | 0.8 | 3.2 |
| Alberta | 4,731 | 4,962 | 5,005 | 0.9 | 5.8 |
| British Columbia | 4,704 | 4,787 | 4,814 | 0.6 | 2.4 |
| Yukon | 45 | 48 | 50 | 5.5 | 11.8 |
| Northwest Territories | 60 | 60 | 60 | -0.9 | -0.9 |
| Nunavut | 27 | 29 | 29 | 1.8 | 8.2 |
Table 2
| September 2009 | August 2010r | September 2010p | August to September 2010 | September 2009 to September 2010 | |
|---|---|---|---|---|---|
| Seasonally adjusted | |||||
| $ millions | % change | ||||
| Total retail trade | 35,259 | 36,203 | 36,418 | 0.6 | 3.3 |
| Total excluding motor vehicle and parts dealers | 27,573 | 28,230 | 28,347 | 0.4 | 2.8 |
| Total excluding motor vehicle and parts dealers and gasoline stations | 23,939 | 24,334 | 24,431 | 0.4 | 2.1 |
| Motor vehicle and parts dealers | 7,686 | 7,973 | 8,070 | 1.2 | 5.0 |
| New car dealers | 6,103 | 6,399 | 6,494 | 1.5 | 6.4 |
| Used car dealers | 497 | 478 | 489 | 2.2 | -1.7 |
| Other motor vehicle dealers | 570 | 573 | 565 | -1.4 | -0.8 |
| Automotive parts, accessories and tire stores | 515 | 522 | 523 | 0.1 | 1.5 |
| Furniture and home furnishing stores | 1,222 | 1,192 | 1,201 | 0.7 | -1.7 |
| Furniture stores | 804 | 777 | 787 | 1.3 | -2.2 |
| Home furnishings stores | 418 | 415 | 414 | -0.2 | -0.9 |
| Electronics and appliance stores | 1,115 | 1,143 | 1,151 | 0.7 | 3.3 |
| Building material and garden equipment and supplies dealers | 2,320 | 2,250 | 2,215 | -1.6 | -4.5 |
| Food and beverage stores | 8,470 | 8,744 | 8,732 | -0.1 | 3.1 |
| Supermarkets and other grocery (except convenience) stores | 6,038 | 6,258 | 6,246 | -0.2 | 3.4 |
| Convenience stores | 577 | 559 | 554 | -0.9 | -4.0 |
| Specialty food stores | 378 | 413 | 418 | 1.3 | 10.5 |
| Beer, wine and liquor stores | 1,477 | 1,515 | 1,515 | 0.0 | 2.6 |
| Health and personal care stores | 2,582 | 2,582 | 2,585 | 0.1 | 0.1 |
| Gasoline stations | 3,634 | 3,896 | 3,917 | 0.5 | 7.8 |
| Clothing and clothing accessories stores | 1,930 | 2,045 | 2,067 | 1.0 | 7.1 |
| Clothing stores | 1,499 | 1,603 | 1,619 | 1.0 | 8.0 |
| Shoe stores | 233 | 236 | 243 | 3.2 | 4.5 |
| Jewellery, luggage and leather goods stores | 199 | 207 | 205 | -1.0 | 3.2 |
| Sporting goods, hobby, book and music stores | 954 | 937 | 959 | 2.3 | 0.6 |
| General merchandise stores | 4,404 | 4,559 | 4,648 | 2.0 | 5.5 |
| Miscellaneous store retailers | 943 | 882 | 874 | -0.9 | -7.3 |
It is possible to consult the tables of unadjusted data by industry and by province and territory from the Tables by subject module of our website.
For information on related indicators, refer to the Latest statistics page on our website.
Note to readers
All the data in this release are seasonally adjusted and in current dollars, unless otherwise noted.
Total retail sales by volume are measured by deflating values in current dollars of the various trade groups using consumer price indexes. This retail sales in chained dollars series (2002) is a chain Fisher volume index with 2002 as the reference year.
Available on CANSIM: tables 080-0020 and 080-0021.
Definitions, data sources and methods: survey numbers, including related surveys, 2406 and 2408.
The September 2010 issue of Retail Trade (63-005-X, free) will be available shortly.
Data on retail trade for October will be released on December 21.
For more information, or to order data, contact Client Services (613-951-3549; toll-free 1-877-421-3067; retailinfo@statcan.gc.ca). For analytical information, or to enquire about the concepts, methods or data quality of this release, contact Jake W. Purdy (613-951-0984), Distributive Trades Division.

