Common menu bar links
Industrial capacity utilization rates
Archived Content
Information identified as archived is provided for reference, research or recordkeeping purposes. It is not subject to the Government of Canada Web Standards and has not been altered or updated since it was archived. Please "contact us" to request a format other than those available.
Related subjects
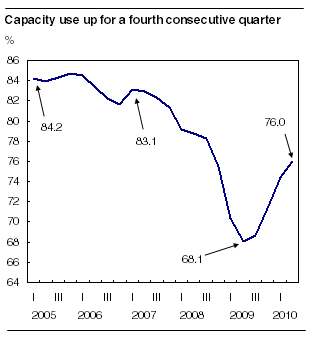
Canadian industries operated at 76.0% of their production capacity in the second quarter, up 1.6 percentage points from the previous quarter. This was the fourth consecutive quarterly increase.

Since the record low of 68.1% set in the second quarter of 2009, the industrial capacity utilization rate has risen by 7.9 percentage points to 76.0%.
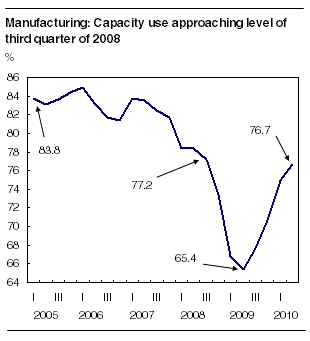
The strength recorded by Canadian industries as a whole was driven by both the manufacturing sector, which saw its rate climb from 75.0% to 76.7%, and the non-manufacturing sector.
Most manufacturing industries post gains
Capacity use was up in 16 of the 21 major manufacturing industries.
Capacity use in total manufacturing increased 1.7 percentage points in the second quarter to 76.7%. Although this was the fourth consecutive gain, the increase fell short of the advances recorded during the previous three quarters.

Industries contributing to the higher rate for total manufacturing were transportation equipment, primary metal, machinery manufacturing and wood product manufacturing.
The transportation equipment industry operated at 66.6% of its capacity in the second quarter, up 2.1 percentage points from the previous quarter. Growth in the industry's capacity use was a result of higher production by manufacturers of motor vehicles and motor vehicle parts and manufacturers of railroad rolling stock.
Note to readers
The industrial capacity utilization rate is the ratio of an industry's actual output to its estimated potential output. The measures of actual output used in the production of the rates of capacity use are the measures of real gross domestic product at factor cost, seasonally adjusted, by industry.
With this release, rates have been revised back to the first quarter of 2008 to reflect the revised source data.
In the primary metal manufacturing industry, the utilization rate increased 5.1 percentage points from the previous quarter to 90.9%. Appreciable gains in production were posted by all metal manufacturing industries except alumina and aluminium production and processing.
Machinery manufacturers used 74.2% of their production capacity, up from 71.0% in the previous quarter. Higher production of agricultural, construction and mining machinery, industrial machinery, and commercial and service industry machinery was behind the gain in capacity use.
Capacity utilization by the wood product manufacturing industry advanced from 74.4% to 78.1%. The main contributing factor was higher production by sawmills and by veneer, plywood and engineered wood product manufacturers.
Declines in computer and electronic product manufacturing (from 95.2% to 89.8%) and chemical manufacturing (from 82.6% to 81.5%) slowed the growth of the manufacturing sector.
Non-manufacturing: Capacity use continues to rise in most sectors
In the non-manufacturing group, capacity use advanced in all sectors except electric power generation, transmission and distribution.
In the forestry and logging sector, capacity utilization rose 9.9 percentage points from the previous quarter to 89.9% in the second quarter.
The oil and gas extraction sector also increased its capacity use from 77.2% to 81.5% over the same period. This gain reflects higher crude petroleum extraction activity, which more than offsets lower activity in natural gas facilities.
The mining extraction industry increased its capacity use from 66.3% in the first quarter to 69.0% in the second quarter, mainly as a result of copper, nickel, lead, zinc and potash extraction activity.
Capacity utilization in the construction sector edged up from 72.1% to 72.9%, as production in residential construction rose 2.8%.
In the electric power generation, transmission and distribution sector, the utilization rate fell from 77.8% in the first quarter to 75.6% in the second quarter. Demand for electricity was down 2.1% in the second quarter from the first quarter.
Available on CANSIM: table 028-0002.
Definitions, data sources and methods: survey number 2821.
Data on industrial capacity utilization rates for the third quarter will be released on December 13.
For more information, or to enquire about the concepts, methods or data quality of this release, contact Luc Provençal (613-951-1960; luc.provencal@statcan.gc.ca), Investment and Capital Stock Division.
Table 1
| Second quarter 2009r | First quarter 2010r | Second quarter 2010 | First quarter to second quarter 2010 | Second quarter 2009 to second quarter 2010 | |
|---|---|---|---|---|---|
| utilization rates | percentage point change | ||||
| Total industrial | 68.1 | 74.4 | 76.0 | 1.6 | 7.9 |
| Forestry and logging | 68.8 | 80.0 | 89.9 | 9.9 | 21.1 |
| Mining and oil and gas extraction | 70.0 | 73.7 | 77.5 | 3.8 | 7.5 |
| Oil and gas extraction | 77.2 | 77.2 | 81.5 | 4.3 | 4.3 |
| Mining | 53.7 | 66.3 | 69.0 | 2.7 | 15.3 |
| Electric power generation, transmission and distribution | 79.0 | 77.8 | 75.6 | -2.2 | -3.4 |
| Construction | 69.1 | 72.1 | 72.9 | 0.8 | 3.8 |
| Manufacturing | 65.4 | 75.0 | 76.7 | 1.7 | 11.3 |
| Food | 80.9 | 82.7 | 83.8 | 1.1 | 2.9 |
| Beverage and tobacco products | 64.3 | 64.5 | 67.0 | 2.5 | 2.7 |
| Beverage | 62.9 | 61.4 | 63.7 | 2.3 | 0.8 |
| Tobacco | 73.1 | 84.2 | 86.8 | 2.6 | 13.7 |
| Textile mills | 66.8 | 72.4 | 74.6 | 2.2 | 7.8 |
| Textile product mills | 61.1 | 75.6 | 75.5 | -0.1 | 14.4 |
| Clothing | 63.5 | 55.8 | 56.9 | 1.1 | -6.6 |
| Leather and allied products | 61.6 | 58.1 | 49.4 | -8.7 | -12.2 |
| Wood products | 58.2 | 74.4 | 78.1 | 3.7 | 19.9 |
| Paper | 75.9 | 87.6 | 88.0 | 0.4 | 12.1 |
| Printing and related support activities | 65.9 | 63.0 | 63.7 | 0.7 | -2.2 |
| Petroleum and coal products | 74.6 | 76.7 | 77.9 | 1.2 | 3.3 |
| Chemical | 68.7 | 82.6 | 81.5 | -1.1 | 12.8 |
| Plastics and rubber products | 63.1 | 71.2 | 73.5 | 2.3 | 10.4 |
| Plastic products | 63.2 | 69.9 | 71.0 | 1.1 | 7.8 |
| Rubber products | 62.6 | 77.1 | 85.2 | 8.1 | 22.6 |
| Non-metallic mineral products | 66.1 | 74.9 | 79.9 | 5.0 | 13.8 |
| Primary metal | 67.8 | 85.8 | 90.9 | 5.1 | 23.1 |
| Fabricated metal products | 63.9 | 71.4 | 73.2 | 1.8 | 9.3 |
| Machinery | 65.3 | 71.0 | 74.2 | 3.2 | 8.9 |
| Computer and electronic products | 82.3 | 95.2 | 89.8 | -5.4 | 7.5 |
| Electrical equipment, appliance and component | 73.9 | 81.5 | 86.7 | 5.2 | 12.8 |
| Transportation equipment | 48.5 | 64.5 | 66.6 | 2.1 | 18.1 |
| Furniture and related products | 73.9 | 81.0 | 81.7 | 0.7 | 7.8 |
| Miscellaneous manufacturing | 85.7 | 82.1 | 81.6 | -0.5 | -4.1 |

