Common menu bar links
New Housing Price Index
Archived Content
Information identified as archived is provided for reference, research or recordkeeping purposes. It is not subject to the Government of Canada Web Standards and has not been altered or updated since it was archived. Please "contact us" to request a format other than those available.

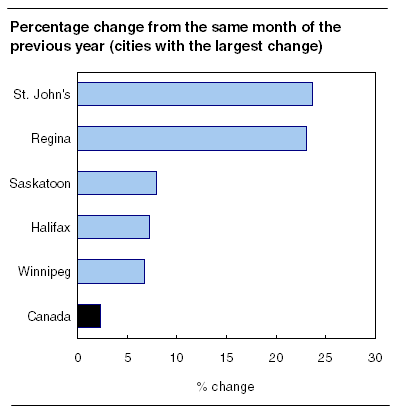
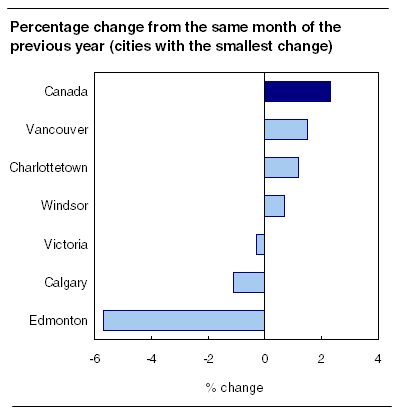
The New Housing Price Index increased, year-over-year, by 2.3% in August compared with 2.7% in July.
On a monthly basis, prices were unchanged between July and August, with the New Housing Price Index remaining at 158.6 (1997=100).
Regionally, prices rose at the fastest pace in St. John's with an annual price increase of 23.7%. Builders reported that material and labour costs, as well as higher land development costs, contributed to the increases in this city.

Regina, which registered no monthly price change in August, had the second highest annual increase for surveyed Canadian cities at 23.1%. However, this was down from its record increase of 34.0% in April of this year.
In Saskatoon, the year-over-year increase was 8.0%, again confirming a trend of deceleration in this city. On a month-over-month basis, new housing prices decreased by 3.1% as Saskatoon builders reported slowing market conditions and stiff competition from the resale housing market.
Edmonton recorded a 12-month drop of 5.7%, which was a 23-year low, and Calgary (-1.1%) registered the lowest annual price change since November 1991.
On the West Coast, the 12-month increase for Vancouver was 1.5%. In Victoria, contractors' selling prices dropped by 0.3% year-over-year.
In Toronto, contractors' selling prices were 3.4% higher than in August last year, and 4.1% higher in Ottawa–Gatineau.
In Québec, the 12-month growth rate accelerated to 6.1%, while in Montréal, prices increased 5.2%.

Available on CANSIM: table 327-0005.
Definitions, data sources and methods: survey number 2310.
The third quarter 2008 issue of Capital Expenditure Price Statistics (62-007-XWE, free) will be available in January 2009.
For more information, or to enquire about the concepts, methods or data quality of this release, contact Client Services (613-951-9606; toll-free 1-866-230-2248, fax: 613-951-1539; prices-prix@statcan.gc.ca), Prices Division.


 Table(s).