
Statistics Canada
www.statcan.gc.ca
Common menu bar links
University tuition fees

Archived Content
Information identified as archived is provided for reference, research or recordkeeping purposes. It is not subject to the Government of Canada Web Standards and has not been altered or updated since it was archived. Please "contact us" to request a format other than those available.

Students attending Canadian universities for undergraduate studies this fall faced a smaller increase in tuition fees on average than they did last year.
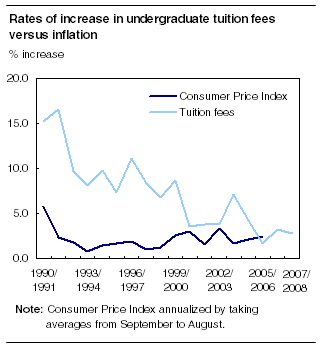
Canadian full-time students in undergraduate programs are paying on average 2.8% more in tuition fees for the 2007/2008 academic year. This compares with a 3.2% increase for the previous year, and average annual increases of 4.3% during the last decade.
Canadian full-time undergraduate students are paying an average of $4,524 in tuition fees for the 2007/2008 academic year, up from $4,400 the year before. In 1998/1999, they paid $3,064 on average, and in 1988/1989, they paid $1,185.
During the 1990s, the undergraduate tuition fees increased at an annual average rate of more than 9.6%. Since 2000, increases have slowed to an average of 3.8%.
Canadian full-time graduate students are paying an average of $5,447 in tuition fees for the 2007/2008 academic year, up from $5,387 a year before.
This reflects government moves to limit tuition increases. Even with limited increases, the tuition paid by full-time undergraduate students has increased on average at a faster rate than that of inflation, as measured by the Consumer Price Index. However, since 2001/2002 both rates of increase have tended to be closer.
Note to readersThe Survey of Tuition and Living Accommodation Costs for Full-time Students at Canadian Degree-granting Institutions (TLAC), which was administered from April to June 2007 to collect data on 2007/2008 tuition fees, has undergone important modifications. The survey universe was increased from around 60 institutions in previous years to 102 institutions this year. In addition, the program classification, according to which tuition data are obtained, adopted the Classification of Instructional Programs (CIP) coding. This new coding structure is now used for all postsecondary surveys and the Census of population. This allows the use of more recent and more accurate university enrolment data, which are also based on CIP, for the calculation of weighted tuition fees. Finally, data on the subject specific tuition fees paid by graduate students are now as detailed as those for undergraduate students. These changes have a minimal impact on the interprovincial comparability of tuition data. But the comparability of tuition data across fields of programs will be affected. Given that a different subject classification is used, it is impossible to produce weighted average tuitions paid in a manner consistent with previous years. In some cases (e.g., medicine, education and a few others), the classification remained consistent. For these disciplines, the only factor affecting the comparability of weighted averages to previous years is the number of institutions that provided tuition data. In other cases (e.g., arts and sciences), the category no longer exists and the tuition for programs under that category may now appear under two or three different categories. It is not possible to map the tuition provided in the new categories to the categories used in preceding years. All fees are reported in current dollars. Data shown represent only a portion of all costs incurred for attending university. TLAC is an administrative survey with minimum response burden and resource requirement. Such a survey can only provide a portion of the total real cost of obtaining a university education. Additionally, data in this release do not account for the student financial assistance provided. |
Tuition fees up in six provinces
Tuition fees for the 2007/2008 academic year for full-time undergraduate students rose in six provinces, including Quebec, where a freeze on tuition fees for residents, in place for more than 10 years, was lifted earlier this year.
The biggest increases were in New Brunswick and in Quebec, where fees rose 4.8%, and in Ontario, where they grew 4.4%.
Fees declined in two provinces: Prince Edward Island (-9.8%) and Nova Scotia (-8.5%). They remained virtually unchanged in Newfoundland and Labrador and Saskatchewan.
Despite substantial declines, the highest fees were again seen in Nova Scotia, where tuition cost undergrads $5,878 on average.
Even with Quebec's decision to lift the freeze, Quebec's students still paid just $2,025 on average, less than half the national average. Fees were also below the national average in three other provinces: Newfoundland and Labrador, Prince Edward Island and Manitoba.
It should be noted that in Quebec and Nova Scotia, the tuition fee structure includes a different fee for resident and non-resident students. The calculations of weighted averages take that distinction into account.
The tuition for Canadian full-time students in graduate programs increased at a lower rate than for undergraduate students this year. In 2007/2008, Canadian full-time graduate students faced average tuition fees of $5,447, an increase of 1.1% over last year. This increase is less than half the rise in undergraduate tuition.
Tuition fees in professional fields still appear to be the highest
Compared with the 2006/2007 academic year, the biggest increases in undergraduate tuition fees for full-time students this fall were in the fields of physical and life sciences and technologies (+4.6%), in visual and performing arts and communication technologies (+3.9%) and in engineering (+3.8%).
Undergraduate students in medicine pay the highest tuition, $9,937 on average, up 2.9% from the previous year. Those in law saw a 2.5% rise to an average of $7,334.
The highest fees paid by Canadian full-time students in graduate programs are in business, management and public administration ($13,702) and in medicine ($7,168).
The biggest increases in graduate tuition fees from 2006/2007 were found in humanities (+3.7%), social and behavioral sciences (+3.7%) and in architecture and related technologies (+3.5%).
It should be noted that the subject with the highest tuition, business, management and public administration, is also the only one that showed a decrease from the previous year.
| Average undergraduate tuition fees for Canadian full-time students by faculty | |||
|---|---|---|---|
| 2006/2007 | 2007/2008 | 2006/2007 to 2007/2008 | |
| current $ | % change | ||
| Education | 3,373 | 3,473 | 3.0 |
| Visual and performing arts, and communications technologies | 3,991 | 4,148 | 3.9 |
| Humanities | 4,336 | 4,459 | 2.8 |
| Social and behavioral science | 4,041 | 4,156 | 2.8 |
| Law | 7,155 | 7,334 | 2.5 |
| Business, management and public administration | 4,195 | 4,271 | 1.8 |
| Physical and life sciences and technology | 4,270 | 4,467 | 4.6 |
| Mathematics, computer and information science | 4,650 | 4,700 | 1.1 |
| Engineering | 4,943 | 5,131 | 3.8 |
| Architecture and related technologies | 3,839 | 3,957 | 3.1 |
| Agriculture, natural resources and conservation | 3,869 | 3,963 | 2.4 |
| Medicine | 9,659 | 9,937 | 2.9 |
| Parks, recreation, health (other than medicine) and fitness | 4,996 | 5,099 | 2.1 |
| Average graduate tuition fees for Canadian full-time students by faculty | |||
|---|---|---|---|
| 2006/2007 | 2007/2008 | 2006/2007 to 2007/2008 | |
| current $ | % change | ||
| Education | 4,627 | 4,684 | 1.2 |
| Visual and performing arts, and communications technologies | 3,679 | 3,726 | 1.3 |
| Humanities | 3,531 | 3,660 | 3.7 |
| Social and behavioral science | 3,579 | 3,711 | 3.7 |
| Law | 3,272 | 3,323 | 1.6 |
| Business, management and public administration | 14,879 | 13,702 | -7.9 |
| Physical and life sciences and technology | 4,104 | 4,215 | 2.7 |
| Mathematics, computer and information science | 4,129 | 4,216 | 2.1 |
| Engineering | 4,221 | 4,340 | 2.8 |
| Architecture and related technologies | 4,153 | 4,297 | 3.5 |
| Agriculture, natural resources and conservation | 2,830 | 2,884 | 1.9 |
| Medicine | 6,976 | 7,168 | 2.8 |
| Parks, recreation, health (other than medicine) and fitness | 4,649 | 4,689 | 0.9 |
International students also pay more
Full-time undergraduate international students also faced increases in tuition this fall. Nationally, these students are paying fees that are 4.5% higher than the previous academic year.
The average tuition fees for full-time undergraduate international students are $13,985, over three times the fees that Canadian students pay.
Tuition fees for international students rose in all provinces except Prince Edward Island and Nova Scotia.
Increases ranged from highs of 6.2% in Quebec and 5.6% in Saskatchewan to lows of 1.7% in Manitoba and 0.2% in Newfoundland and Labrador.
Additional compulsory fees on the rise
The bundle of services included in additional compulsory fees varies from one institution to the next and can also change over time. Typically, they include fees for recreation and athletics, student health services, student association and other fees that apply to full-time Canadian students.
Additional compulsory fees are generally exempt from any provincial tuition fee policy.
Additional compulsory fees for undergraduates make up 12.8% of the total fees a student is required to pay to the institution. This proportion was 10.7% in 1998/1999. Nationally, additional fees this fall rose by 10.0% over last year.
On average, students are paying $663 in additional compulsory fees in the current academic year, up from $603 last year.
The highest additional compulsory fees are in Nova Scotia and Prince Edward Island, while the lowest are in New Brunswick. The largest increase in additional compulsory fees was in Nova Scotia, with the next highest increase in Quebec.
Additional compulsory fees remained stable in Newfoundland and Labrador.
Definitions, data sources and methods: survey number 3123.
Information is also available on the cost of accommodation on campus.
For general information, to order data, or to enquire about the concepts, methods or data quality of this release, contact Client Services (toll-free 1-800-307-3382; 613-951-7608; fax: 613-951-4441; educationstats@statcan.gc.ca), Culture, Tourism and the Centre for Education Statistics Division.
 Table(s).