Common menu bar links
New Housing Price Index
Archived Content
Information identified as archived is provided for reference, research or recordkeeping purposes. It is not subject to the Government of Canada Web Standards and has not been altered or updated since it was archived. Please "contact us" to request a format other than those available.

New housing prices in Canada increased at their slowest pace in just over a year in May, continuing a trend in deceleration that started in September 2006.
Contractors' selling prices in May were 8.6% higher than they were in May 2006. This increase was slightly slower than the 8.9% year-over-year gain recorded in April.
It was the slowest increase since April 2006. However, May still marked the 14th consecutive month of year-over-year increases above 8%.
On a monthly basis, new housing prices were up 1.1% from April. The New Housing Price Index for May reached 152.1 (1997=100).
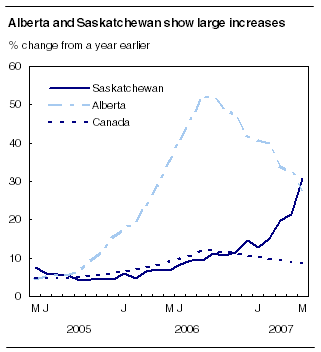
Housing prices in Saskatchewan (+30.7%) and Alberta (+27.9%) accounted for most of the 8.6% year-over-year increase in May.
Year-over-year gains of only 2.6% in Ontario and 3.8% in Quebec had a moderating influence on the national average.
By far the biggest year-over-year increase on a municipal basis occurred in the census metropolitan area (CMA) of Saskatoon. This was largely due to the healthy economy of Saskatchewan and its recent population growth, the result of recent net gains in interprovincial migration from Alberta.

Saskatoon contractors increased their prices by 38.6% between May 2006 and May 2007. In Regina, the year-over-year rise was 21.6%. These were the fastest advances for both CMAs in 26 years and continued a year-long trend of accelerating price increases.
Contractors in the CMA of Edmonton recorded a year-over-year gain of 37.0% in May, while prices in Calgary were up 22.0%. While still substantial, these price increases represented a 10-month low for Edmonton and a 16-month low for Calgary.
After recording a dizzying year-over-year increase of 60.6% in August 2006, price advances in Calgary have since decelerated every month. Prices in Edmonton have slowed down after a high growth rate of 42.8% in November 2006.
The only other CMA to show an increase above the national average was Vancouver. Contractors there boosted their prices by 8.8% from May 2006, continuing a recent trend of accelerating price increases.
In Winnipeg, the year-over-year rise was 6.5%, its slowest since June 2004, in line with a recent trend in deceleration. Trailing all CMAs in the West was Victoria, where new housing prices were virtually stable (+0.3%).
Halifax recorded a year-over-year increase of 7.1%, its largest since 1985. St. John's is also starting to show a healthier market. Prices there rose 4.8%, the fastest gain in nine months, and above the Atlantic Provinces' average of 3.9%.
In Central Canada, homebuilders in Hamilton increased their prices by 6.1% from May 2006, the 11th consecutive month of growth above 5% for this CMA.
Greater Sudbury and Thunder Bay followed with a 4.7% gain, mainly the result of increases in the wages of skilled trade labourers. A 4.3% rise in London was due to competitive factors and increases in land prices.
Increases in wage rates and material costs resulted in gains of 3.9% in Montréal and 3.5% in Québec. The only CMA to record a year-over-year decline was Windsor, where prices fell 1.0%, the eighth consecutive monthly decrease.
On a monthly basis, prices rose 10.9% between April and May in Saskatoon, 4.0% in Regina and 4.7% in Halifax. No CMA in Central Canada recorded increases of more than 1.0%.
The only CMAs to show monthly declines were Windsor (-0.2%) and St. Catharines–Niagara (-0.1%).
Available on CANSIM: table 327-0005.
Definitions, data sources and methods: survey number 2310.
The first quarter 2007 issue of Capital Expenditure Price Statistics (62-007-XWE, free) will be available soon.
For more information, or to enquire about the concepts, methods or data quality of this release, contact Client Services (613-951-9606, fax: 613-951-1539; prices-prix@statcan.gc.ca) or Neil Killips (613-951-5722; neil.killips@statcan.gc.ca), Prices Division.


 Table(s).