Common menu bar links
Canada's population
Archived Content
Information identified as archived is provided for reference, research or recordkeeping purposes. It is not subject to the Government of Canada Web Standards and has not been altered or updated since it was archived. Please "contact us" to request a format other than those available.

The population of Alberta, in the midst of an unprecedented economic boom, rose at its fastest quarterly pace in 25 years between July and September.
Alberta's population grew by 1.12% during the third quarter to reach 3,413,500 as of October 1, 2006.
This rate of growth was more than three times the 0.33% increase in Canada's total population. As of October 1, 2006, Canada's population was estimated at 32,730,200, up 106,700 from July 1, 2006. (These estimates are based on 2001 Census counts adjusted for net census undercoverage to which is added the estimated demographic growth between May 15, 2001 and October 1, 2006.)
Alberta's economy is in the midst of the strongest period of economic growth ever recorded by any province, according to a study released this September in the Canadian Economic Observer.
Net gains in migration from other jurisdictions accounted for close to two-thirds of Alberta's demographic growth during the third quarter. Alberta recorded a net increase from interprovincial migration of 24,500, surpassing the previous high of 16,800 during the third quarter of 1980, another oil boom era.
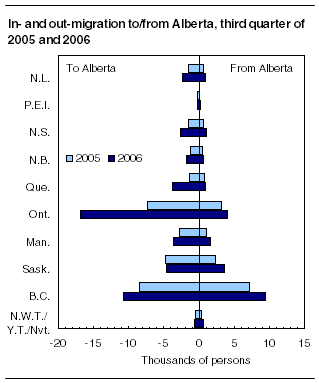
Net interprovincial losses from Quebec and Ontario to Alberta were more than three times higher in the third quarter of 2006 compared to the same quarter in 2005. From July to September 2006, Ontario lost a net total of 12,800 people to Alberta, compared with 4,100 in the same three months last year. Quebec lost an estimated 2,900 to Alberta, up from 600.

Despite Alberta's booming economy, many people are moving out of the province as well. During the third quarter, an estimated 22,800 people left Alberta, compared with 16,800 in the same quarter last year. This was the highest third-quarter loss for Alberta since 23,600 in 1989.
While the majority of those leaving Alberta went to British Columbia, departures from Alberta have benefited Saskatchewan the most. Saskatchewan's net migration loss to Alberta in the third quarter this year was down by an estimated 1,300 people compared with the third quarter in 2005. That is because Saskatchewan received 3,700 migrants from Alberta between July and September, compared with only 2,400 in the same three months of 2005.
Quebec's population increased 0.23% in the third quarter, below the national average, as larger losses to interprovincial migration offset gains in natural growth and net international migration. In fact, Quebec's birth rate was above the national average for the first time since the beginning of the 1980s. Its international migration rate was the highest since 1992 for a third quarter.
For the first time since 1980, Ontario's third-quarter population increase was below the national average, notably as a result of negative net interprovincial migration. Without the benefit of the nation's highest immigration rate, Ontario would have incurred a net loss in population.
Besides Alberta, British Columbia was the only other jurisdiction showing both a net gain in interprovincial migration and a population growth higher than the national average. While it recorded a net loss to Alberta of 1,300 during the last quarter, British Columbia had a net gain of 3,400 persons from the rest of the country.
In the Atlantic provinces, only Prince Edward Island had positive net population growth. The other three Atlantic provinces, still affected by large net interprovincial migration losses and the lowest rate of natural increase in Canada, posted population decreases. For Nova Scotia, it was the first negative third quarter since 1971.
Available on CANSIM: tables 051-0005, 051-0006, 051-0017, 051-0020, 051-0037, 051-0045, 053-0001.
Definitions, data sources and methods: survey numbers, including related surveys, 3231, 3233 and 3601.
The publication Quarterly Demographic Estimates, Vol. 20, no. 3 (91-002-XWE, free) is now available online from the Publications module of our website.
To obtain additional data, or to enquire about the concepts, methods or data quality of this release, please contact Client Services (toll-free 1-866-767-5611 or 613-951-2320; fax: 613-951-2307; demography@statcan.gc.ca), Demography Division.


 Table(s).