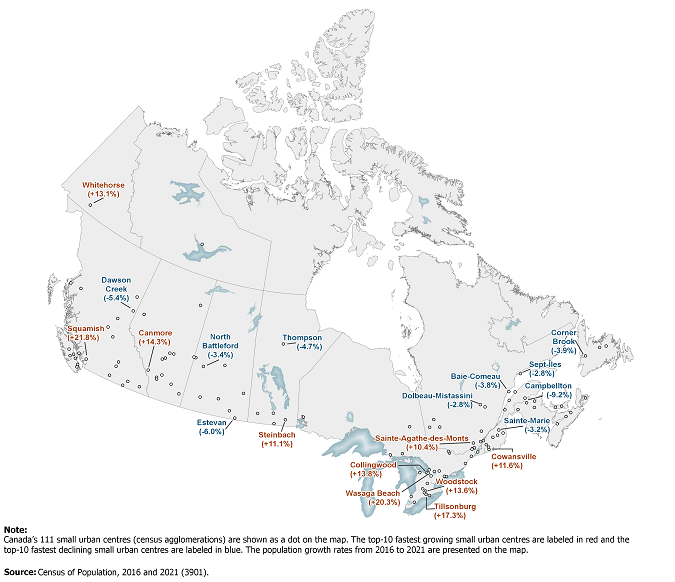
Map 3
Fastest growing small urban centres often close to Canada's largest metropolises while fastest declining small urban centres often in more remote locations

Map description
The title of the map is "Fastest growing small urban centres often close to Canada's largest metropolises while fastest declining small urban centres often in more remote locations"
On this map, Canada's 111 small urban centres (census agglomerations) are shown as a dot. The top-10 fastest growing small urban centres are labeled in red and the top-10 fastest declining small urban centres are labeled in blue. The population growth rates from 2016 to 2021 are presented on the map.
From west to east:
The population growth rate from 2016 to 2021 was +13.1% for Whitehorse (labeled in red).
The population growth rate from 2016 to 2021 was +21.8% for Squamish (labeled in red).
The population growth rate from 2016 to 2021 was -5.4% for Dawson Creek (labeled in blue).
The population growth rate from 2016 to 2021 was +14.3% for Canmore (labeled in red).
The population growth rate from 2016 to 2021 was -3.4% for North Battleford (labeled in blue).
The population growth rate from 2016 to 2021 was -6.0% for Estevan (labeled in blue).
The population growth rate from 2016 to 2021 was -4.7% for Thompson (labeled in blue).
The population growth rate from 2016 to 2021 was +11.1% for Steinbach (labeled in red).
The population growth rate from 2016 to 2021 was +13.6% for Woodstock (labeled in red).
The population growth rate from 2016 to 2021 was +17.3% for Tillsonburg (labeled in red).
The population growth rate from 2016 to 2021 was +13.8% for Collingwood (labeled in red).
The population growth rate from 2016 to 2021 was +20.3% for Wasaga Beach (labeled in red).
The population growth rate from 2016 to 2021 was +10.4% for Sainte-Agathe-des-Monts (labeled in red).
The population growth rate from 2016 to 2021 was -2.8% for Dolbeau-Mistassini (labeled in blue).
The population growth rate from 2016 to 2021 was +11.6% for Cowansville (labeled in red).
The population growth rate from 2016 to 2021 was -3.2% for Sainte-Marie (labeled in blue).
The population growth rate from 2016 to 2021 was -3.8% for Baie-Comeau (labeled in blue).
The population growth rate from 2016 to 2021 was -2.8% for Sept-Iles (labeled in blue).
The population growth rate from 2016 to 2021 was -9.2% for Campbellton (labeled in blue).
The population growth rate from 2016 to 2021 was -3.9% for Corner Brook (labeled in blue).
Source: Census of Population, 2016 and 2021 (3901).
- Date modified: